Chart Types
- apexcharts:
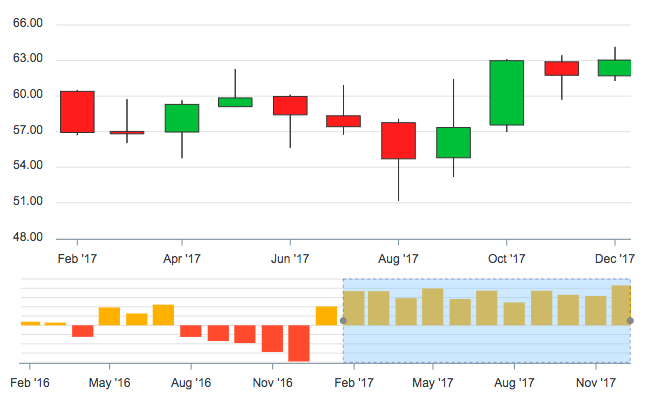
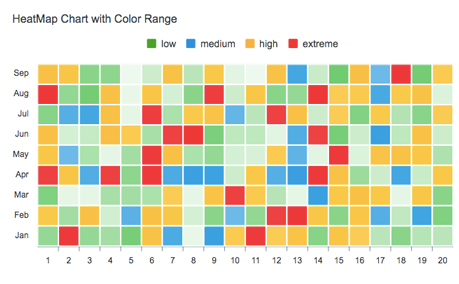
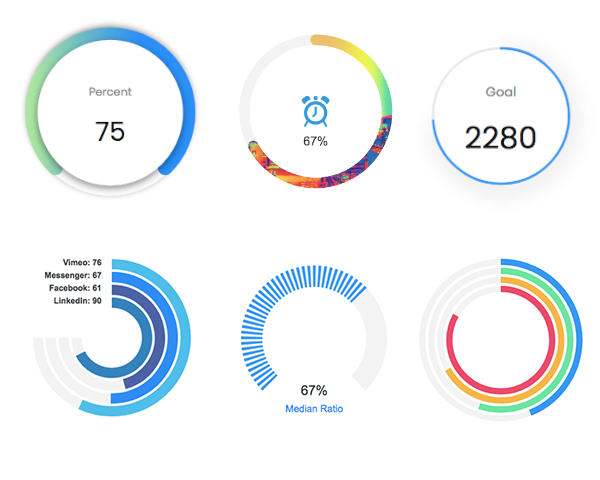
apexchartssupports a wide variety of chart types, including line, area, bar, column, pie, donut, radial bar, and more. It also offers advanced chart types like mixed charts, heatmaps, and treemaps, providing flexibility for different data visualization needs. - recharts:
rechartsprovides a good selection of chart types, including line, bar, area, pie, radar, and scatter charts. While it may not have as many built-in chart types asapexcharts, its composable nature allows developers to create custom chart types by combining existing components.
Customization
- apexcharts:
apexchartsoffers extensive customization options for almost every aspect of the charts, including colors, labels, tooltips, legends, and animations. It also supports dynamic updates and real-time data visualization, allowing for interactive and engaging charts. - recharts:
rechartsprovides a high level of customization through its React component architecture. Developers can easily style components, create custom tooltips, legends, and even build entirely custom chart components by leveraging the flexibility of React.
Interactivity
- apexcharts:
apexchartsincludes built-in interactivity features such as tooltips, zooming, panning, and data point selection. It also supports events and callbacks, allowing developers to handle user interactions and update the chart dynamically. - recharts:
rechartssupports interactivity through its React components, including tooltips, legends, and event handling. Developers can easily add interactive features by leveraging React's state and props, making it highly customizable.
Integration
- apexcharts:
apexchartscan be easily integrated into any web application, regardless of the framework. It provides a simple API for creating charts with just a few lines of code, and it works well with both vanilla JavaScript and modern frameworks like React, Angular, and Vue. - recharts:
rechartsis specifically designed for React applications, making it a great choice for projects that use React. Its component-based architecture allows for seamless integration and reusability within React components.
Documentation and Community
- apexcharts:
apexchartshas comprehensive documentation, including examples, API references, and tutorials. It also has an active community and support channels, making it easy for developers to find help and resources. - recharts:
rechartsoffers good documentation with examples and guides for using the library. Being an open-source project, it has a growing community of contributors and users who share resources and provide support.
Ease of Use: Code Examples
- apexcharts:
Simple Line Chart with
apexcharts<div id="chart"></div> <script src="https://cdn.jsdelivr.net/npm/apexcharts"></script> <script> var options = { chart: { type: 'line', height: 350 }, series: [{ name: 'Sales', data: [30, 40, 35, 50, 49, 60, 70] }], xaxis: { categories: ['Jan', 'Feb', 'Mar', 'Apr', 'May', 'Jun', 'Jul'] } }; var chart = new ApexCharts(document.querySelector('#chart'), options); chart.render(); </script> - recharts:
Simple Line Chart with
rechartsimport React from 'react'; import { LineChart, Line, XAxis, YAxis, CartesianGrid, Tooltip, Legend } from 'recharts'; const data = [ { name: 'Jan', sales: 30 }, { name: 'Feb', sales: 40 }, { name: 'Mar', sales: 35 }, { name: 'Apr', sales: 50 }, { name: 'May', sales: 49 }, { name: 'Jun', sales: 60 }, { name: 'Jul', sales: 70 } ]; const SimpleLineChart = () => ( <LineChart width={600} height={300} data={data}> <CartesianGrid strokeDasharray="3 3" /> <XAxis dataKey="name" /> <YAxis /> <Tooltip /> <Legend /> <Line type="monotone" dataKey="sales" stroke="#8884d8" /> </LineChart> ); export default SimpleLineChart;