Integration
- dd-trace:
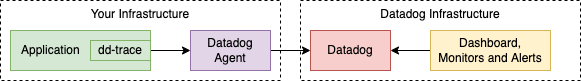
dd-trace integrates seamlessly with Datadog, providing out-of-the-box support for various frameworks and languages, making it easy to set up and start monitoring your applications immediately.
- jaeger-client:
jaeger-client supports multiple languages and integrates with various systems, allowing you to trace requests across different services and visualize them in the Jaeger UI.
- opentracing:
opentracing is designed to be vendor-agnostic, allowing you to integrate with any tracing backend that supports the OpenTracing standard, giving you flexibility in choosing your observability tools.
- prom-client:
prom-client integrates well with Prometheus, enabling you to collect and expose metrics from your application for monitoring, but it does not provide tracing capabilities.
- tracer:
tracer is lightweight and easy to integrate into existing applications, making it suitable for quick implementations without complex setups.
- zipkin:
zipkin provides easy integration with various libraries and frameworks, allowing you to collect trace data from multiple sources and visualize it in the Zipkin UI.
Data Collection
- dd-trace:
dd-trace automatically collects trace data, including spans and context propagation, without requiring extensive manual instrumentation, simplifying the monitoring process.
- jaeger-client:
jaeger-client allows for detailed data collection, including custom tags and logs, giving you deep insights into the performance of your microservices.
- opentracing:
opentracing provides a flexible API for manual instrumentation, allowing you to define spans and context propagation as needed, giving you control over what data is collected.
- prom-client:
prom-client focuses on metrics collection rather than tracing, allowing you to gather performance metrics like request counts and latencies, which can complement trace data.
- tracer:
tracer provides basic data collection capabilities, allowing you to instrument your code with minimal effort, making it suitable for simple use cases.
- zipkin:
zipkin collects trace data in a structured format, allowing you to visualize the flow of requests and identify latency issues across your services.
Performance Impact
- dd-trace:
dd-trace is designed to minimize performance overhead, using sampling and asynchronous data transmission to ensure that monitoring does not significantly impact application performance.
- jaeger-client:
jaeger-client is optimized for high throughput and low latency, making it suitable for production environments where performance is critical.
- opentracing:
opentracing itself does not impose performance overhead, as it is an API specification. The performance impact depends on the underlying implementation you choose.
- prom-client:
prom-client has a low performance impact when collecting metrics, but it is not designed for tracing, so it should be used in conjunction with a tracing library for complete observability.
- tracer:
tracer is lightweight and has minimal performance impact, making it suitable for applications where overhead needs to be kept to a minimum.
- zipkin:
zipkin is designed to handle large volumes of trace data efficiently, but the performance impact can vary based on how it is implemented and the volume of data being collected.
Visualization
- dd-trace:
dd-trace provides rich visualizations in the Datadog dashboard, allowing you to see traces, performance metrics, and error rates in a unified view, making it easy to identify issues.
- jaeger-client:
jaeger-client offers a powerful UI for visualizing traces, allowing you to see the entire request flow and identify bottlenecks in your microservices architecture.
- opentracing:
opentracing does not provide visualization itself, as it is an API specification. Visualization depends on the tracing backend you choose to implement.
- prom-client:
prom-client does not provide visualization for traces but can be used with Grafana to visualize metrics, offering insights into application performance alongside trace data.
- tracer:
tracer does not include built-in visualization tools, but you can export trace data to other systems for visualization, depending on your needs.
- zipkin:
zipkin provides a user-friendly interface for visualizing trace data, allowing you to see the relationships between services and identify latency issues quickly.
Community and Support
- dd-trace:
dd-trace benefits from strong community support and extensive documentation, backed by Datadog's resources, making it easy to find help and examples.
- jaeger-client:
jaeger-client has a vibrant open-source community, with ample documentation and support available for users, making it easier to troubleshoot and implement.
- opentracing:
opentracing has a large community of contributors and users, providing a wealth of resources and documentation to help developers implement tracing in their applications.
- prom-client:
prom-client has a solid community around Prometheus, with many resources available for users looking to implement metrics collection in their applications.
- tracer:
tracer has a smaller community compared to others, but it is straightforward to use, and documentation is available for common use cases.
- zipkin:
zipkin has a strong open-source community, with good documentation and support available, making it easier for developers to implement and troubleshoot.