react-graph-vis vs vis-network
Graph Visualization Libraries
react-graph-visvis-network

Graph Visualization Libraries

Graph visualization libraries in JavaScript provide tools for creating interactive and visually appealing representations of networks, graphs, and relationships between data points. These libraries are essential for applications that require visualizing complex structures such as social networks, organizational charts, or data flow diagrams. They offer features like customizable nodes and edges, various layout algorithms, and interactivity options such as zooming, panning, and event handling. These libraries help developers create intuitive and engaging visualizations that can aid in data analysis, presentation, and user interaction. react-graph-vis is a React wrapper for the vis.js library, providing an easy way to integrate network, timeline, and graph visualizations into React applications. It leverages the powerful features of vis.js while offering a React-friendly API. vis-network is a standalone library for creating interactive network visualizations. It is part of the vis.js suite but can be used independently. It provides extensive customization options, various layout algorithms, and supports large datasets, making it suitable for complex network visualizations.

Npm Package Weekly Downloads Trend

3 Years

Github Stars Ranking

Stat Detail

Package
Downloads
Stars
Size
Issues
Publish
License
react-graph-vis0990-605 years agoMIT
vis-network03,53782.9 MB3446 months ago(Apache-2.0 OR MIT)

Feature Comparison: react-graph-vis vs vis-network

Integration with React

  • react-graph-vis:

    react-graph-vis is designed specifically for React applications, providing a seamless integration with React's component-based architecture. It allows developers to use React's state and props to control the visualization, making it easy to update and manage the graph dynamically.

  • vis-network:

    vis-network is a standalone library that can be used with any JavaScript framework or vanilla JS. It does not have built-in React integration, so developers need to handle the integration manually if used within a React application.

Customization

  • react-graph-vis:

    react-graph-vis inherits the customization capabilities of vis.js, allowing developers to customize nodes, edges, and overall graph appearance. However, the customization is somewhat limited by the React wrapper, which may not expose all the underlying features of vis.js.

  • vis-network:

    vis-network offers extensive customization options for nodes, edges, and the overall network. It provides more flexibility for advanced customization, including custom shapes, styles, and behaviors, making it suitable for complex visualizations.

Interactivity

  • react-graph-vis:

    react-graph-vis provides basic interactivity features such as zooming, panning, and event handling (e.g., click, hover) through the React component. It is easy to use and integrates well with React's event system.

  • vis-network:

    vis-network offers more advanced interactivity features, including dynamic manipulation of the network, real-time updates, and more granular control over events. It is better suited for applications that require complex interactions and real-time data visualization.

Performance

  • react-graph-vis:

    react-graph-vis is suitable for small to medium-sized graphs. Performance may be impacted when dealing with very large datasets, especially within the React rendering cycle.

  • vis-network:

    vis-network is optimized for handling large networks and provides better performance for visualizing large datasets. It includes features like clustering and hierarchical layouts to improve performance and readability.

Ease of Use: Code Examples

  • react-graph-vis:

    react-graph-vis provides a simple API for integrating network visualizations into React applications. It is easy to use for developers familiar with React, and the documentation includes examples and guides for common use cases.

  • vis-network:

    vis-network has comprehensive documentation and examples that cover a wide range of features. However, it may require more time to learn and implement advanced features compared to react-graph-vis.

How to Choose: react-graph-vis vs vis-network

  • react-graph-vis:

    Choose react-graph-vis if you are working within a React application and want a simple way to integrate network visualizations. It is ideal for projects where you need to quickly add interactive graphs without dealing with the underlying implementation details.

  • vis-network:

    Choose vis-network if you need a standalone solution for creating highly customizable and interactive network visualizations. It is suitable for projects that require more control over the visualization and can be used with any JavaScript framework or vanilla JS.

README for react-graph-vis

React graph vis

A React component to display beautiful network graphs using vis.js

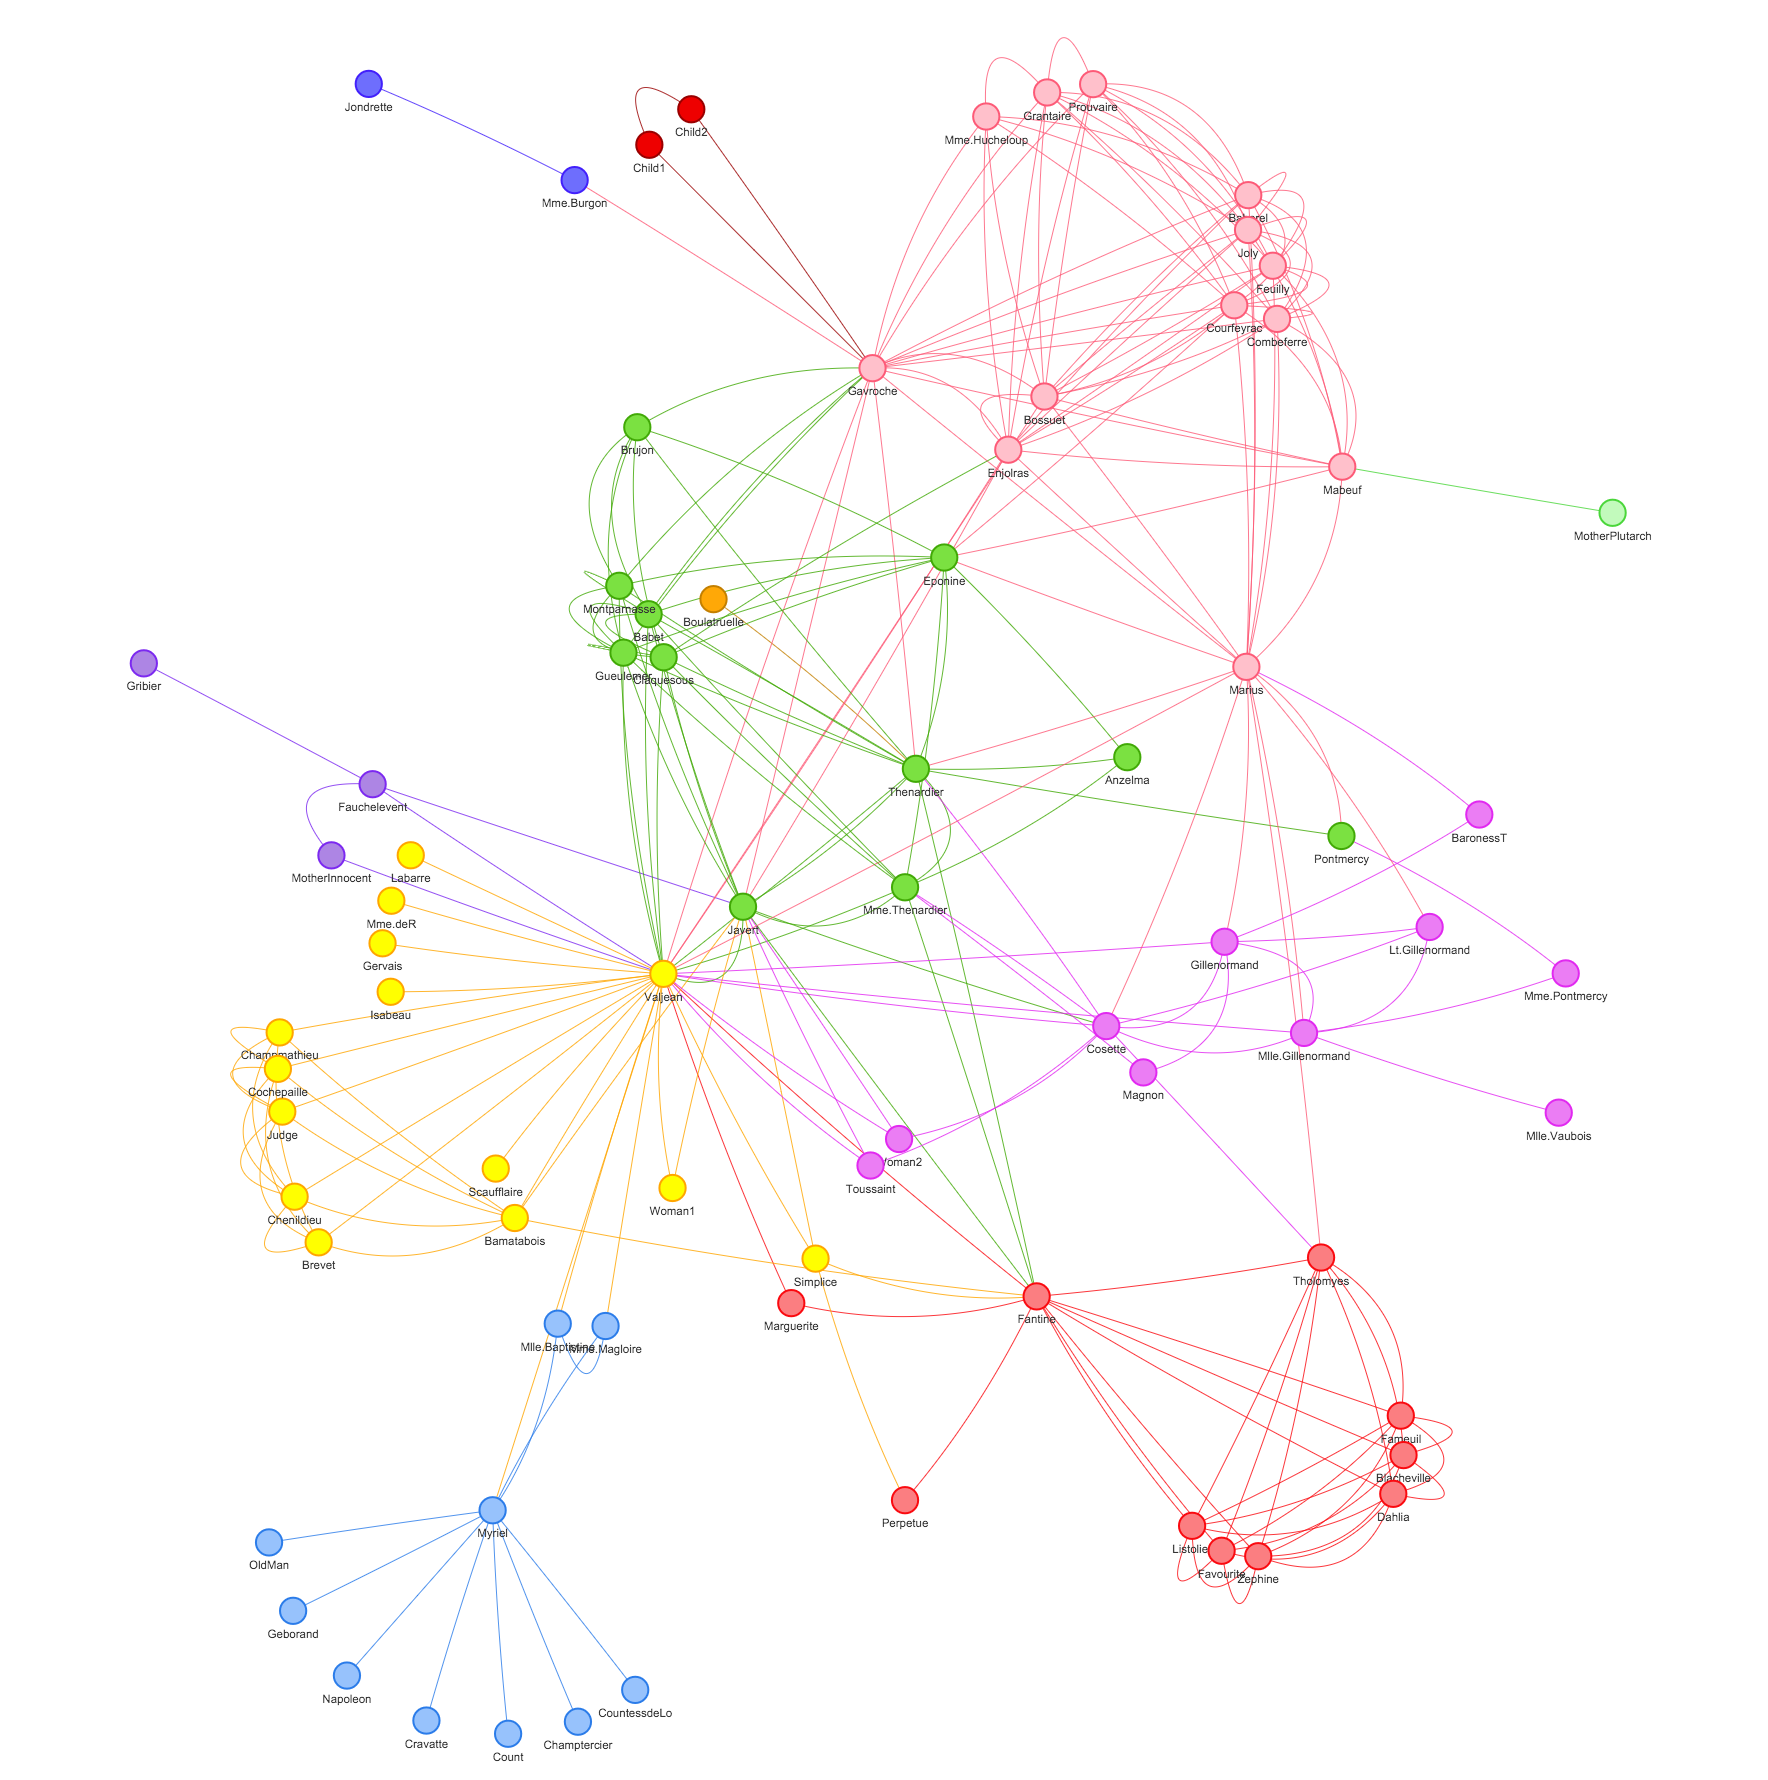
Show, don't tell: Demo

Make sure to visit visjs.org for more info.

Rendered graphs are scrollable, zoomable, retina ready, dynamic, and switch layout on double click.

A graph rendered by vis js

Due to the imperative nature of vis.js, updating graph properties causes complete redraw of graph and completely porting it to React is a big project itself!

This component takes three vis.js configuration objects as properties:

  • graph: contains two arrays { edges, nodes }
  • options: normal vis.js options as described here
  • events: an object that has event name as keys and their callback as values

Usage

import React from "react";
import ReactDOM from "react-dom";
import Graph from "react-graph-vis";

import "./styles.css";
// need to import the vis network css in order to show tooltip
import "./network.css";

function App() {
  const graph = {
    nodes: [
      { id: 1, label: "Node 1", title: "node 1 tootip text" },
      { id: 2, label: "Node 2", title: "node 2 tootip text" },
      { id: 3, label: "Node 3", title: "node 3 tootip text" },
      { id: 4, label: "Node 4", title: "node 4 tootip text" },
      { id: 5, label: "Node 5", title: "node 5 tootip text" }
    ],
    edges: [
      { from: 1, to: 2 },
      { from: 1, to: 3 },
      { from: 2, to: 4 },
      { from: 2, to: 5 }
    ]
  };

  const options = {
    layout: {
      hierarchical: true
    },
    edges: {
      color: "#000000"
    },
    height: "500px"
  };

  const events = {
    select: function(event) {
      var { nodes, edges } = event;
    }
  };
  return (
    <Graph
      graph={graph}
      options={options}
      events={events}
      getNetwork={network => {
        //  if you want access to vis.js network api you can set the state in a parent component using this property
      }}
    />
  );
}

const rootElement = document.getElementById("root");
ReactDOM.render(<App />, rootElement);

You can also check out the demo in the example folder.