bunyan、debug、loglevel、pino 和 winston 都是 JavaScript 生态中用于日志记录的工具库,但它们的设计目标、适用环境和功能特性差异显著。debug 专注于开发阶段的轻量级调试,通过命名空间控制日志输出;loglevel 为浏览器环境提供类似 console 的 API,支持运行时动态调整日志级别;pino 主打高性能结构化日志,原生面向 Node.js 但可通过适配器用于前端;winston 是功能全面的日志框架,支持多种输出目标和格式化选项;而 bunyan 是较早期的 Node.js 结构化日志库,目前已不推荐在新项目中使用,尤其不适合前端场景。
前端日志库深度对比:bunyan、debug、loglevel、pino 和 winston
在前端工程中,日志系统常被低估,却对调试、监控和用户体验至关重要。本文从真实开发场景出发,深入比较五个主流日志库 —— bunyan、debug、loglevel、pino 和 winston —— 聚焦它们的核心能力、适用边界与技术取舍。
📝 核心定位与设计哲学
bunyan 是一个面向 Node.js 的结构化日志库,强调 JSON 格式输出和命令行工具支持。它并非为浏览器环境设计,在前端项目中使用受限。
debug 极简轻量,通过 localStorage 或 DEBUG 环境变量动态开启/关闭命名空间日志,适合开发阶段的临时调试,不适用于生产级日志收集。
loglevel 专为浏览器打造,提供类似 console.log 的 API,但支持运行时动态调整日志级别,并可轻松扩展(如添加前缀、远程上报)。
pino 主打高性能结构化日志,采用最小化 JSON 输出、避免同步阻塞等策略优化性能,虽主要面向 Node.js,但可通过 pino-browser 适配前端。
winston 是功能全面的日志框架,支持多传输(transports)、格式化器(formatters)和日志级别,架构灵活,但体积较大,需谨慎用于前端。
⚠️ 注意:
bunyan官方明确表示仅支持 Node.js,且自 2018 年后更新极少,不推荐在新项目中使用,尤其不适合前端场景。
🔧 基础用法与 API 风格
所有库都提供类似 logger.info() 的方法,但初始化方式和默认行为差异显著。
// debug: 按命名空间控制
const log = require('debug')('auth:login');
log('User attempting login'); // 仅当 DEBUG=auth:* 时输出
// loglevel: 类 console API,支持运行时调级
const log = require('loglevel');
log.setLevel('info');
log.info('Page loaded');
// pino (Node.js 风格,前端需用 pino-browser)
const pino = require('pino');
const logger = pino({ level: 'info' });
logger.info('Application started');
// winston: 需配置 transports
const { createLogger, transports } = require('winston');
const logger = createLogger({
  level: 'info',
  transports: [new transports.Console()]
});
logger.info('System ready');
// bunyan: Node.js only
const bunyan = require('bunyan');
const logger = bunyan.createLogger({ name: 'app', level: 'info' });
logger.info('Server listening');
🌐 浏览器兼容性与前端适配
debug 和 loglevel 原生支持浏览器,零配置即可使用。
pino 本身不支持浏览器,但官方提供 pino-browser 包,可将日志重定向到 console 并保留结构化特性:
// pino-browser 示例
import pino from 'pino';
const logger = pino({
  browser: {
    transmit: {
      level: 'error',
      send(level, logEvent) {
        // 上报到远程服务
        fetch('/log', { method: 'POST', body: JSON.stringify(logEvent) });
      }
    }
  }
});
winston 可在浏览器中运行,但需手动替换 transport(如用 Console 替代 File),且打包体积显著增加,通常只在复杂 SPA 中考虑。
bunyan 依赖 Node.js 内置模块(如 fs、util),无法在浏览器中直接使用,强行打包会导致构建失败或运行时错误。
📊 日志级别与动态控制
所有库均支持标准日志级别(trace、debug、info、warn、error),但控制机制不同。
debug 通过环境变量或 localStorage.debug 动态开关命名空间:
// 开启所有 auth 相关日志
localStorage.debug = 'auth:*';
loglevel 提供 setLevel() 方法,可在运行时调整:
log.setLevel('warn'); // 仅显示 warn/error
pino 和 winston 支持运行时修改级别,但需保留 logger 实例引用:
// pino
logger.level = 'debug';

// winston
logger.level = 'debug';
bunyan 也支持 logger.level('debug'),但仅限 Node.js。
📤 日志输出与扩展能力
debug 仅输出到 console,无内置扩展机制,适合临时调试。
loglevel 通过插件系统支持扩展,例如 loglevel-plugin-prefix 可添加时间戳:
import prefix from 'loglevel-plugin-prefix';
prefix.reg(log);
prefix.apply(log, { template: '[%t] %l:' });
pino 使用“传输”(transports)概念,但不同于 winston,其核心专注高速写入,异步处理由外部进程完成(如 pino-pretty)。在浏览器中,通过 browser.transmit 配置远程上报。
winston 的核心优势在于 transports 和 formats:
const logger = createLogger({
  format: format.combine(
    format.timestamp(),
    format.json()
  ),
  transports: [
    new transports.Console(),
    new transports.Http({ host: 'logs.example.com' })
  ]
});
bunyan 支持多种输出流(streams),可同时写入文件、stdout 或自定义流,但同样仅限 Node.js。
⚡ 性能与生产考量
debug:生产构建中可通过process.env.DEBUG或 tree-shaking 移除,几乎零开销。loglevel:极小体积(<1KB min+gzip),适合嵌入任何前端项目。pino:在 Node.js 中性能顶尖;前端使用pino-browser时,若启用transmit,需注意网络请求开销。winston:功能强大但体积大(>20KB min+gzip),可能影响首屏加载,建议按需引入 transport。bunyan:不适用于前端,性能讨论无意义。
🛑 弃用与维护状态
根据 npm 和 GitHub 信息:
bunyan自 2018 年后无实质性更新,GitHub 仓库处于低活跃状态,不应在新项目中使用。- 其余四个库(
debug、loglevel、pino、winston)均有近期发布记录,维护活跃。
✅ 推荐场景总结
| 场景 | 推荐库 | 理由 |
|---|---|---|
| 开发阶段临时调试 | debug | 轻量、命名空间控制、无需配置 |
| 简单前端日志,需动态调级 | loglevel | 小巧、类 console API、插件生态 |
| 高性能结构化日志(Node.js) | pino | 极速、JSON 原生、生态工具丰富 |
| 前端结构化日志 + 远程上报 | pino + pino-browser | 保留 pino 优势,适配浏览器 |
| 复杂日志路由(多输出、格式化) | winston | 灵活 transports、formats、成熟稳定 |
| 浏览器项目 | 避免 bunyan | 不兼容、已事实弃用 |
💡 最终建议
- 普通前端项目:首选
loglevel,平衡简洁性与可控性。 - 需要结构化日志并上报:用
pino配合pino-browser,确保日志格式统一。 - 全栈项目且重度依赖日志:Node.js 服务用
pino,前端用loglevel或pino-browser,避免强行统一导致前端臃肿。 - 永远避开
bunyan:它属于上一个时代,前端开发者应彻底忽略。
- debug:
选择
debug如果你只需要在开发阶段进行临时调试,且希望用命名空间(如 'auth:*')动态开启/关闭日志。它极轻量,但不提供日志级别管理或生产环境上报能力,不适合正式日志系统。 - winston:
选择
winston如果你需要高度可定制的日志系统,例如同时输出到控制台、文件和 HTTP 端点,或应用复杂的格式化规则。它功能强大但体积较大,前端项目需评估打包体积影响。 - pino:
选择
pino如果你追求极致性能和结构化 JSON 日志,尤其在 Node.js 服务端。对于前端,可搭配pino-browser使用,以保留结构化优势并支持远程日志上报,但需注意额外配置。 - loglevel:
选择
loglevel如果你在构建前端应用,需要一个简单、小巧且支持运行时调整日志级别的库。它的 API 与 console 一致,易于上手,并可通过插件扩展功能(如添加时间戳或远程上报)。 - bunyan:
不要在新项目中使用
bunyan。它仅支持 Node.js,自 2018 年后基本停止维护,且无法在浏览器环境中运行。如果你在维护遗留系统,应计划迁移到pino或winston。
debug
![]()
![]()
A tiny JavaScript debugging utility modelled after Node.js core's debugging technique. Works in Node.js and web browsers.
Installation
$ npm install debug
Usage
debug exposes a function; simply pass this function the name of your module, and it will return a decorated version of console.error for you to pass debug statements to. This will allow you to toggle the debug output for different parts of your module as well as the module as a whole.
Example app.js:
var debug = require('debug')('http')
  , http = require('http')
  , name = 'My App';

// fake app

debug('booting %o', name);

http.createServer(function(req, res){
  debug(req.method + ' ' + req.url);
  res.end('hello\n');
}).listen(3000, function(){
  debug('listening');
});

// fake worker of some kind

require('./worker');
Example worker.js:
var a = require('debug')('worker:a')
  , b = require('debug')('worker:b');

function work() {
  a('doing lots of uninteresting work');
  setTimeout(work, Math.random() * 1000);
}

work();

function workb() {
  b('doing some work');
  setTimeout(workb, Math.random() * 2000);
}

workb();
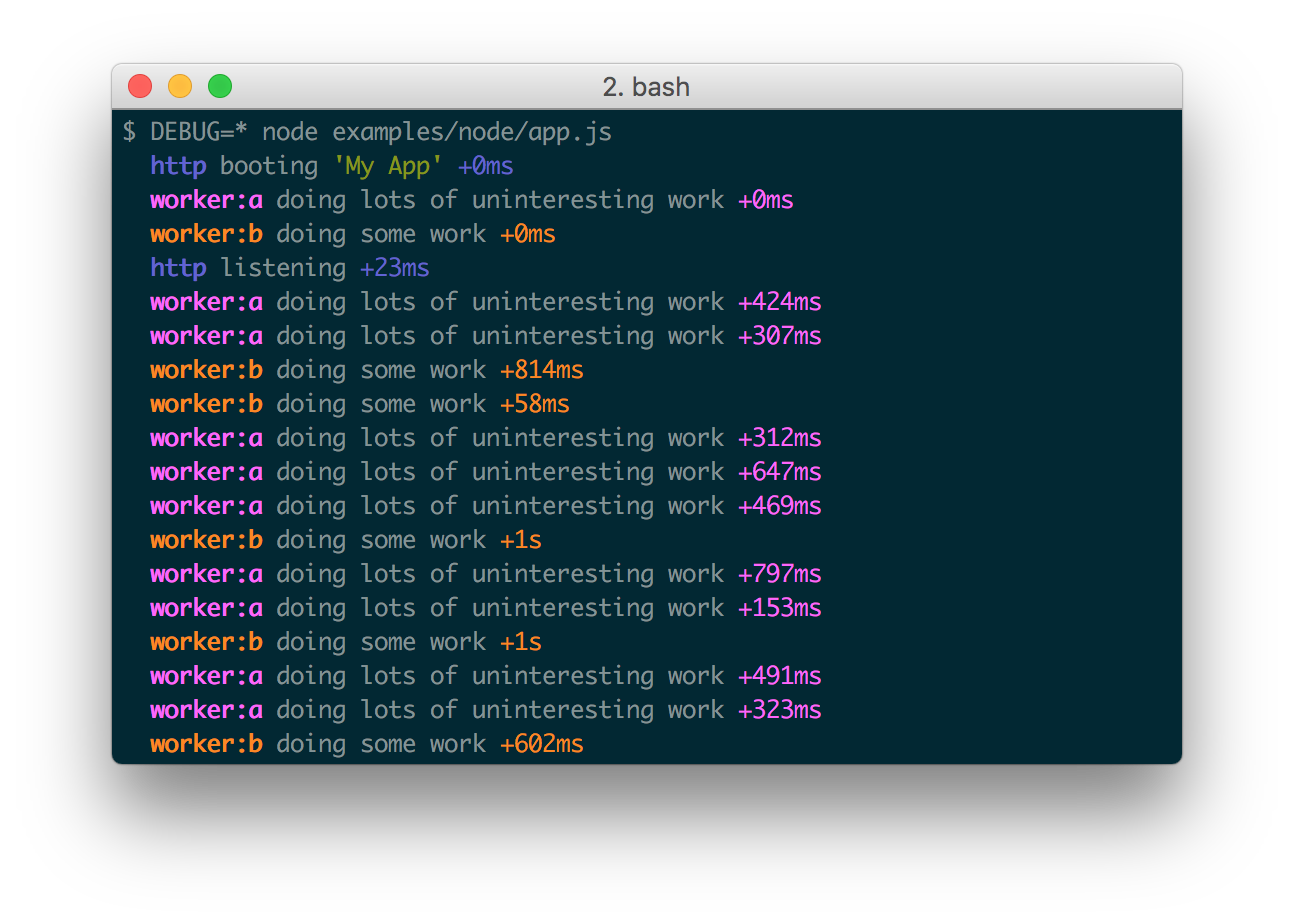
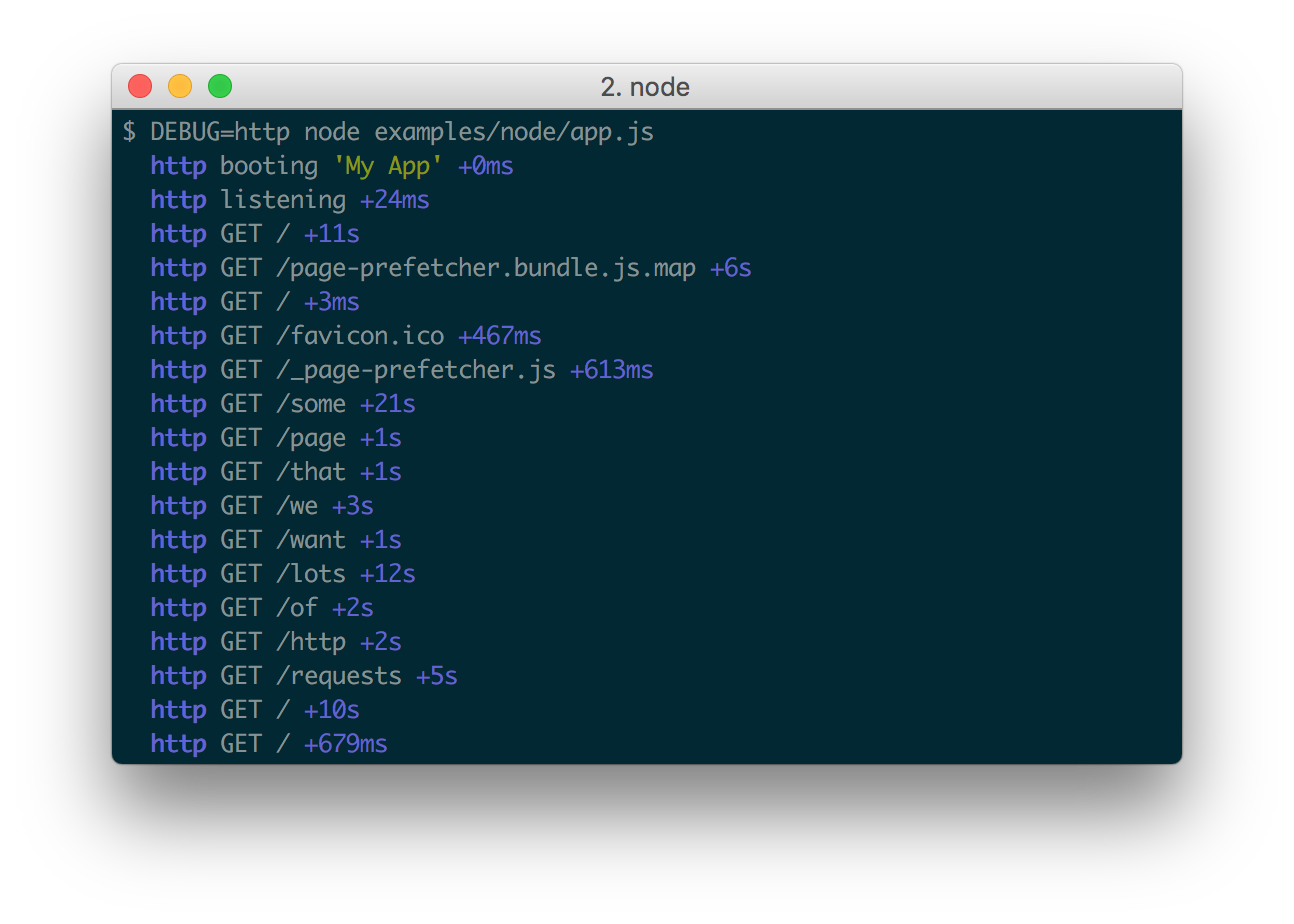
The DEBUG environment variable is then used to enable these based on space or
comma-delimited names.
Here are some examples:
Windows command prompt notes
CMD
On Windows the environment variable is set using the set command.
set DEBUG=*,-not_this
Example:
set DEBUG=* & node app.js
PowerShell (VS Code default)
PowerShell uses different syntax to set environment variables.
$env:DEBUG = "*,-not_this"
Example:
$env:DEBUG='app';node app.js
Then, run the program to be debugged as usual.
npm script example:
"windowsDebug": "@powershell -Command $env:DEBUG='*';node app.js",
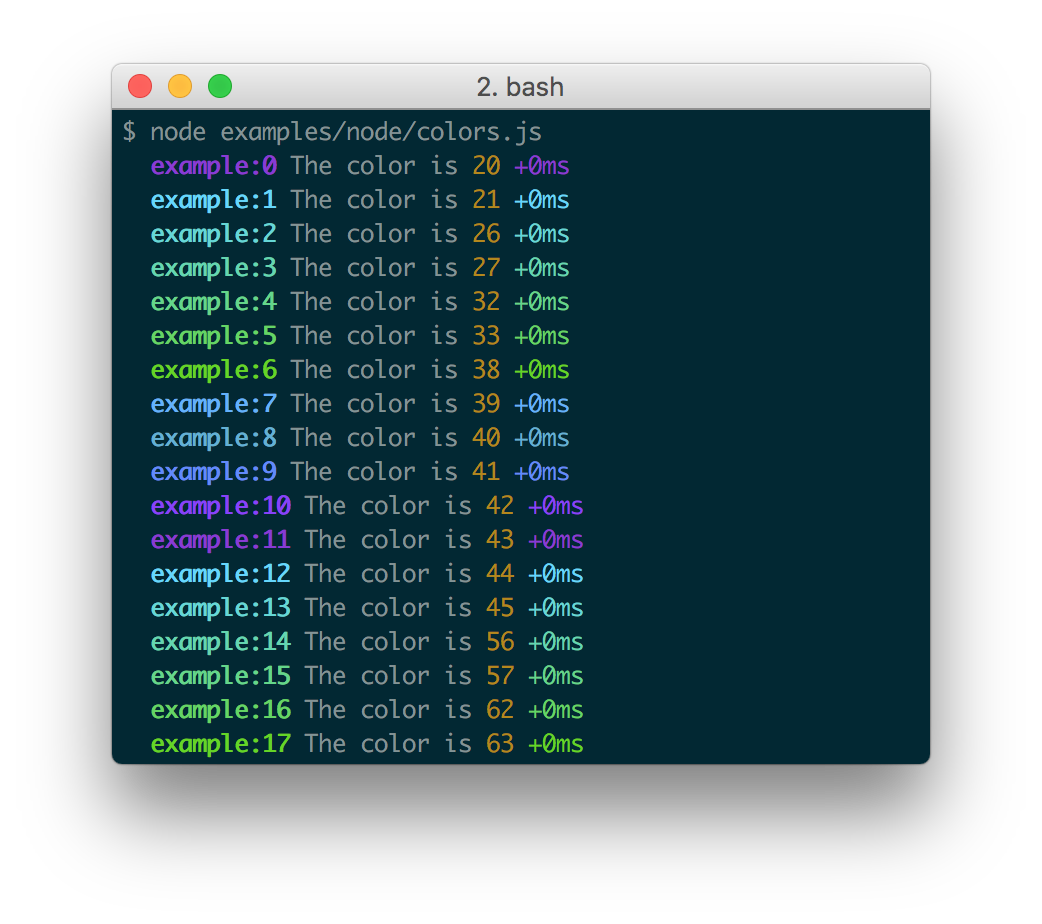
Namespace Colors
Every debug instance has a color generated for it based on its namespace name. This helps when visually parsing the debug output to identify which debug instance a debug line belongs to.
Node.js
In Node.js, colors are enabled when stderr is a TTY. You also should install
the supports-color module alongside debug,
otherwise debug will only use a small handful of basic colors.
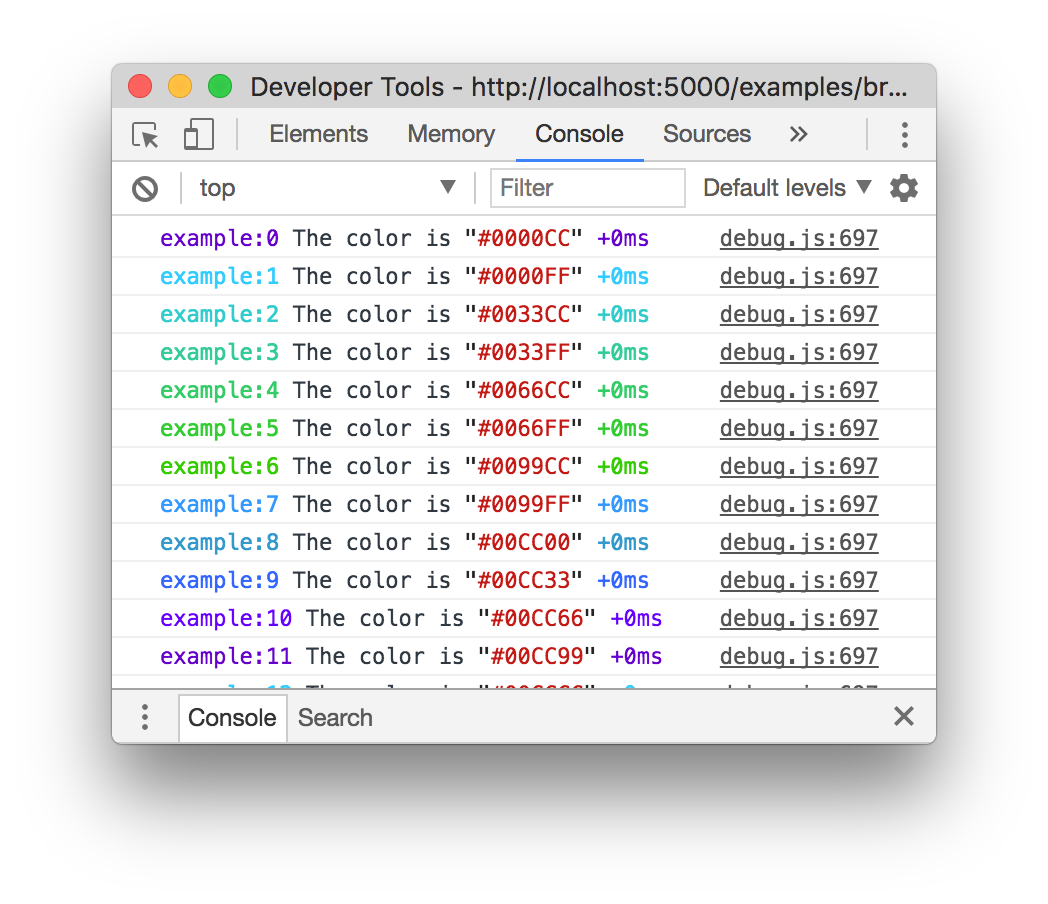
Web Browser
Colors are also enabled on "Web Inspectors" that understand the %c formatting
option. These are WebKit web inspectors, Firefox (since version
31)
and the Firebug plugin for Firefox (any version).
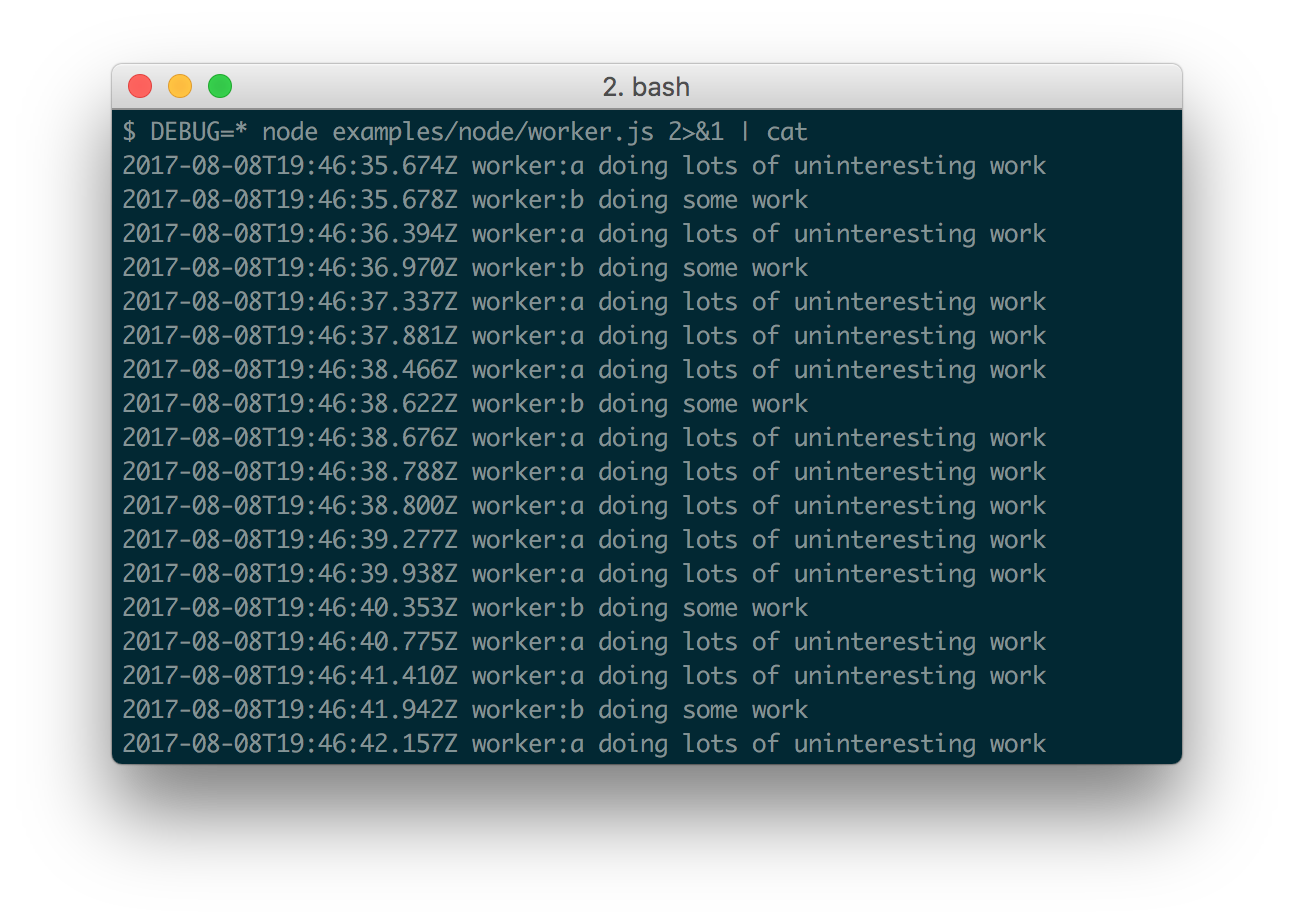
Millisecond diff
When actively developing an application it can be useful to see when the time spent between one debug() call and the next. Suppose for example you invoke debug() before requesting a resource, and after as well, the "+NNNms" will show you how much time was spent between calls.
When stdout is not a TTY, Date#toISOString() is used, making it more useful for logging the debug information as shown below:
Conventions
If you're using this in one or more of your libraries, you should use the name of your library so that developers may toggle debugging as desired without guessing names. If you have more than one debuggers you should prefix them with your library name and use ":" to separate features. For example "bodyParser" from Connect would then be "connect:bodyParser". If you append a "*" to the end of your name, it will always be enabled regardless of the setting of the DEBUG environment variable. You can then use it for normal output as well as debug output.
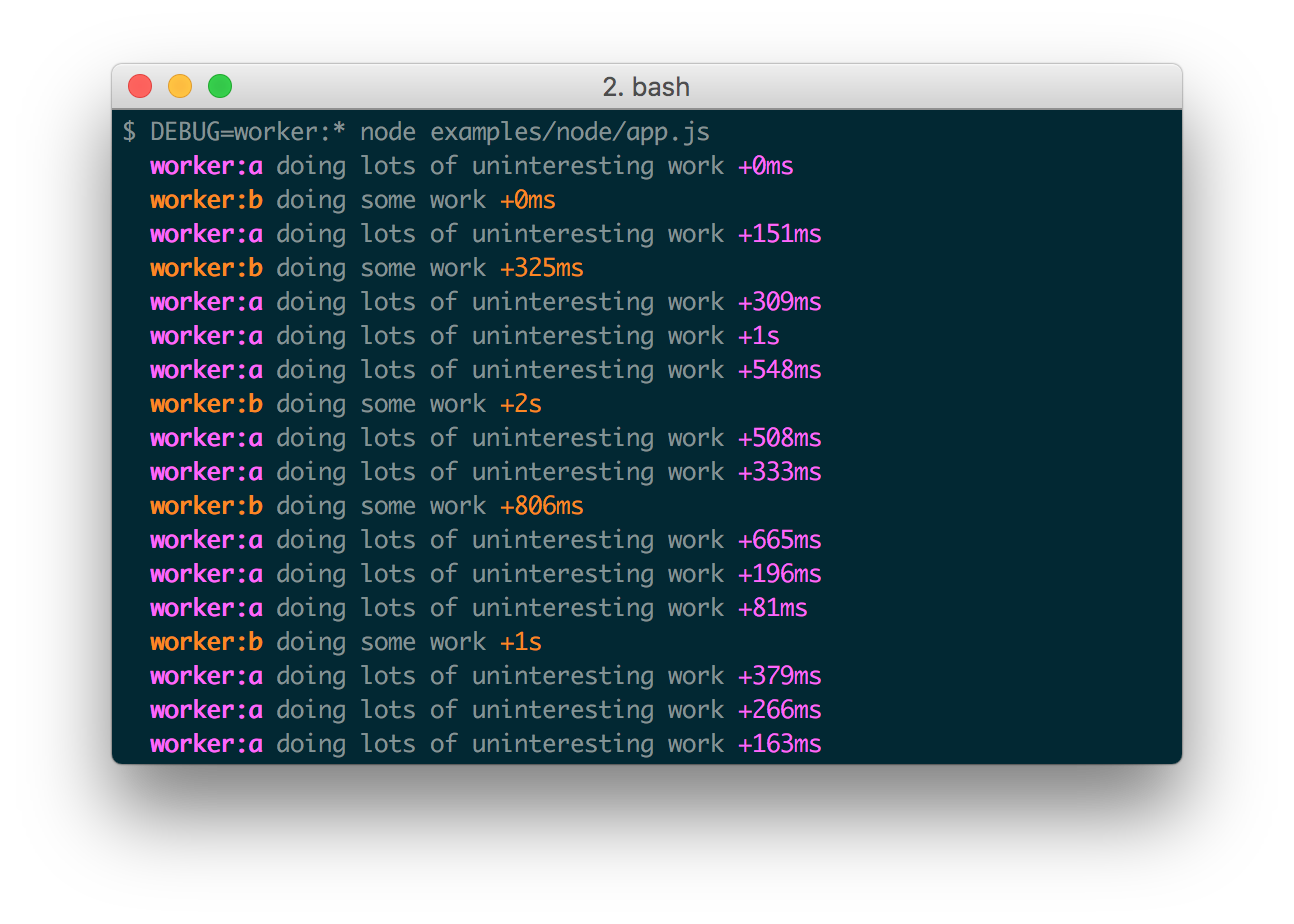
Wildcards
The * character may be used as a wildcard. Suppose for example your library has
debuggers named "connect:bodyParser", "connect:compress", "connect:session",
instead of listing all three with
DEBUG=connect:bodyParser,connect:compress,connect:session, you may simply do
DEBUG=connect:*, or to run everything using this module simply use DEBUG=*.
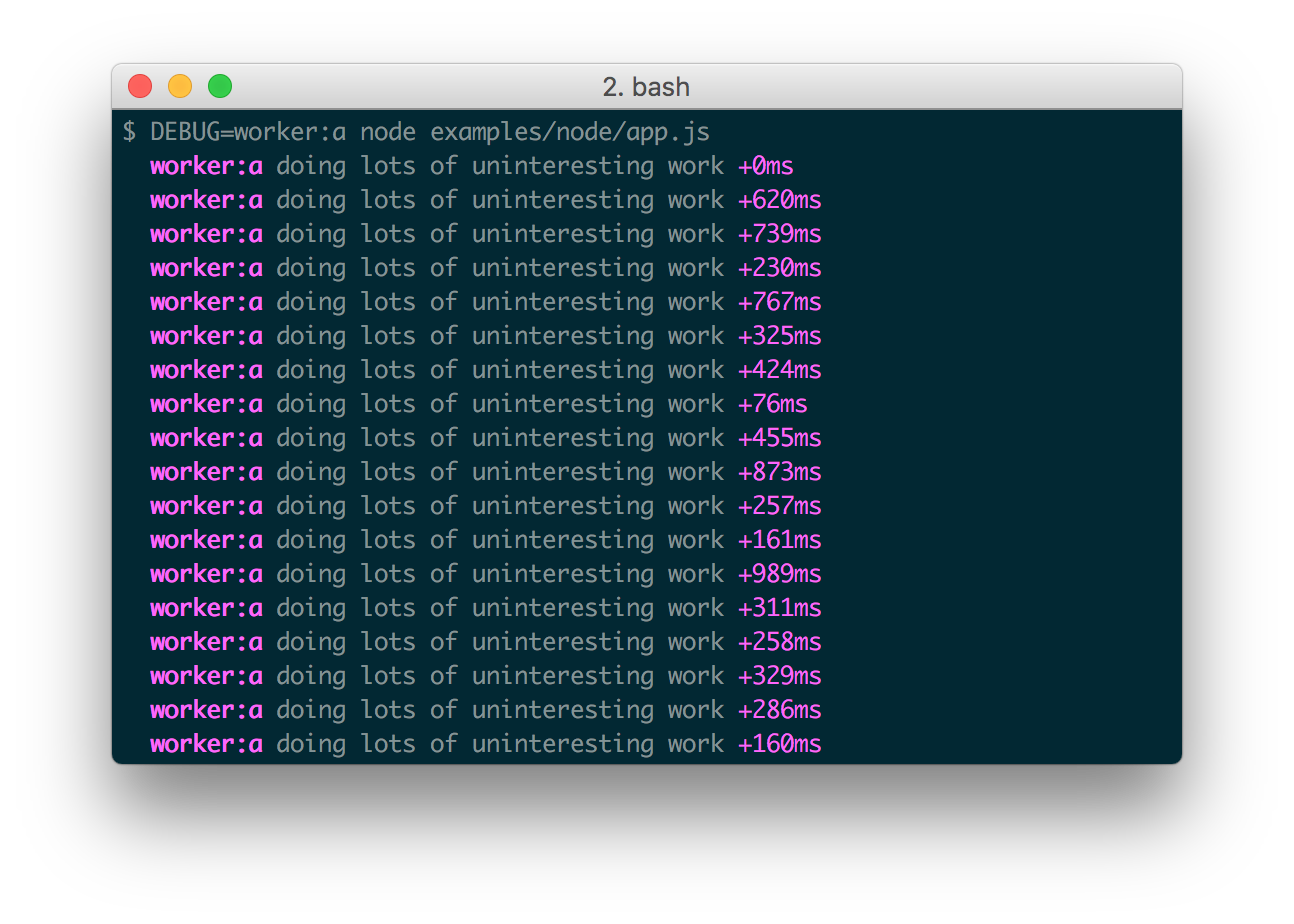
You can also exclude specific debuggers by prefixing them with a "-" character.
For example, DEBUG=*,-connect:* would include all debuggers except those
starting with "connect:".
Environment Variables
When running through Node.js, you can set a few environment variables that will change the behavior of the debug logging:
| Name | Purpose |
|---|---|
DEBUG | Enables/disables specific debugging namespaces. |
DEBUG_HIDE_DATE | Hide date from debug output (non-TTY). |
DEBUG_COLORS | Whether or not to use colors in the debug output. |
DEBUG_DEPTH | Object inspection depth. |
DEBUG_SHOW_HIDDEN | Shows hidden properties on inspected objects. |
Note: The environment variables beginning with DEBUG_ end up being
converted into an Options object that gets used with %o/%O formatters.
See the Node.js documentation for
util.inspect()
for the complete list.
Formatters
Debug uses printf-style formatting. Below are the officially supported formatters:
| Formatter | Representation |
|---|---|
%O | Pretty-print an Object on multiple lines. |
%o | Pretty-print an Object all on a single line. |
%s | String. |
%d | Number (both integer and float). |
%j | JSON. Replaced with the string '[Circular]' if the argument contains circular references. |
%% | Single percent sign ('%'). This does not consume an argument. |
Custom formatters
You can add custom formatters by extending the debug.formatters object.
For example, if you wanted to add support for rendering a Buffer as hex with
%h, you could do something like:
const createDebug = require('debug')
createDebug.formatters.h = (v) => {
  return v.toString('hex')
}

// …elsewhere
const debug = createDebug('foo')
debug('this is hex: %h', new Buffer('hello world'))
//   foo this is hex: 68656c6c6f20776f726c6421 +0ms
Browser Support
You can build a browser-ready script using browserify, or just use the browserify-as-a-service build, if you don't want to build it yourself.
Debug's enable state is currently persisted by localStorage.
Consider the situation shown below where you have worker:a and worker:b,
and wish to debug both. You can enable this using localStorage.debug:
localStorage.debug = 'worker:*'
And then refresh the page.
a = debug('worker:a');
b = debug('worker:b');

setInterval(function(){
  a('doing some work');
}, 1000);

setInterval(function(){
  b('doing some work');
}, 1200);
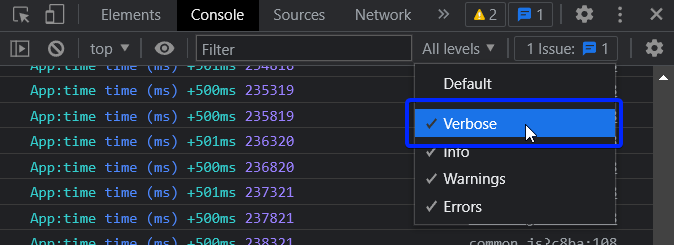
In Chromium-based web browsers (e.g. Brave, Chrome, and Electron), the JavaScript console will—by default—only show messages logged by debug if the "Verbose" log level is enabled.
Output streams
By default debug will log to stderr, however this can be configured per-namespace by overriding the log method:
Example stdout.js:
var debug = require('debug');
var error = debug('app:error');

// by default stderr is used
error('goes to stderr!');

var log = debug('app:log');
// set this namespace to log via console.log
log.log = console.log.bind(console); // don't forget to bind to console!
log('goes to stdout');
error('still goes to stderr!');

// set all output to go via console.info
// overrides all per-namespace log settings
debug.log = console.info.bind(console);
error('now goes to stdout via console.info');
log('still goes to stdout, but via console.info now');
Extend
You can simply extend debugger
const log = require('debug')('auth');

//creates new debug instance with extended namespace
const logSign = log.extend('sign');
const logLogin = log.extend('login');

log('hello'); // auth hello
logSign('hello'); //auth:sign hello
logLogin('hello'); //auth:login hello
Set dynamically
You can also enable debug dynamically by calling the enable() method :
let debug = require('debug');

console.log(1, debug.enabled('test'));

debug.enable('test');
console.log(2, debug.enabled('test'));

debug.disable();
console.log(3, debug.enabled('test'));
print :
1 false
2 true
3 false
Usage :
enable(namespaces)
namespaces can include modes separated by a colon and wildcards.
Note that calling enable() completely overrides previously set DEBUG variable :
$ DEBUG=foo node -e 'var dbg = require("debug"); dbg.enable("bar"); console.log(dbg.enabled("foo"))'
=> false
disable()
Will disable all namespaces. The functions returns the namespaces currently enabled (and skipped). This can be useful if you want to disable debugging temporarily without knowing what was enabled to begin with.
For example:
let debug = require('debug');
debug.enable('foo:*,-foo:bar');
let namespaces = debug.disable();
debug.enable(namespaces);
Note: There is no guarantee that the string will be identical to the initial enable string, but semantically they will be identical.
Checking whether a debug target is enabled
After you've created a debug instance, you can determine whether or not it is
enabled by checking the enabled property:
const debug = require('debug')('http');

if (debug.enabled) {
  // do stuff...
}
You can also manually toggle this property to force the debug instance to be enabled or disabled.
Usage in child processes
Due to the way debug detects if the output is a TTY or not, colors are not shown in child processes when stderr is piped. A solution is to pass the DEBUG_COLORS=1 environment variable to the child process.
For example:
worker = fork(WORKER_WRAP_PATH, [workerPath], {
  stdio: [
    /* stdin: */ 0,
    /* stdout: */ 'pipe',
    /* stderr: */ 'pipe',
    'ipc',
  ],
  env: Object.assign({}, process.env, {
    DEBUG_COLORS: 1 // without this settings, colors won't be shown
  }),
});

worker.stderr.pipe(process.stderr, { end: false });
Authors
- TJ Holowaychuk
- Nathan Rajlich
- Andrew Rhyne
- Josh Junon
Backers
Support us with a monthly donation and help us continue our activities. [Become a backer]
![]()
![]()
![]()
![]()
![]()
![]()
![]()
![]()
![]()
![]()
![]()
![]()
![]()
![]()
![]()
![]()
![]()
![]()
![]()
![]()
![]()
![]()
![]()
![]()
![]()
![]()
![]()
![]()
![]()
![]()
Sponsors
Become a sponsor and get your logo on our README on Github with a link to your site. [Become a sponsor]
![]()
![]()
![]()
![]()
![]()
![]()
![]()
![]()
![]()
![]()
![]()
![]()
![]()
![]()
![]()
![]()
![]()
![]()
![]()
![]()
![]()
![]()
![]()
![]()
![]()
![]()
![]()
![]()
![]()
![]()
License
(The MIT License)
Copyright (c) 2014-2017 TJ Holowaychuk <tj@vision-media.ca> Copyright (c) 2018-2021 Josh Junon
Permission is hereby granted, free of charge, to any person obtaining a copy of this software and associated documentation files (the 'Software'), to deal in the Software without restriction, including without limitation the rights to use, copy, modify, merge, publish, distribute, sublicense, and/or sell copies of the Software, and to permit persons to whom the Software is furnished to do so, subject to the following conditions:
The above copyright notice and this permission notice shall be included in all copies or substantial portions of the Software.
THE SOFTWARE IS PROVIDED 'AS IS', WITHOUT WARRANTY OF ANY KIND, EXPRESS OR IMPLIED, INCLUDING BUT NOT LIMITED TO THE WARRANTIES OF MERCHANTABILITY, FITNESS FOR A PARTICULAR PURPOSE AND NONINFRINGEMENT. IN NO EVENT SHALL THE AUTHORS OR COPYRIGHT HOLDERS BE LIABLE FOR ANY CLAIM, DAMAGES OR OTHER LIABILITY, WHETHER IN AN ACTION OF CONTRACT, TORT OR OTHERWISE, ARISING FROM, OUT OF OR IN CONNECTION WITH THE SOFTWARE OR THE USE OR OTHER DEALINGS IN THE SOFTWARE.