webpack-bundle-analyzer vs source-map-explorer vs size-limit vs bundlewatch
JavaScript Bundle Analysis Tools Comparison
1 Year
webpack-bundle-analyzersource-map-explorersize-limitbundlewatchSimilar Packages:
What's JavaScript Bundle Analysis Tools?

JavaScript bundle analysis tools are essential for optimizing web applications by providing insights into the size and composition of JavaScript bundles. These tools help developers understand the impact of their code on load times and performance, enabling them to make informed decisions about code splitting, tree shaking, and other optimization strategies. By analyzing bundles, developers can identify large dependencies, unused code, and opportunities for improvement, ultimately leading to faster and more efficient web applications.

Package Weekly Downloads Trend
Github Stars Ranking
Stat Detail
Package
Downloads
Stars
Size
Issues
Publish
License
webpack-bundle-analyzer6,141,80012,6321.23 MB31a year agoMIT
source-map-explorer787,7243,879352 kB55-Apache-2.0
size-limit284,8636,70337.5 kB263 months agoMIT
bundlewatch111,93542649.3 kB31a month agoMIT
Feature Comparison: webpack-bundle-analyzer vs source-map-explorer vs size-limit vs bundlewatch

Bundle Size Monitoring
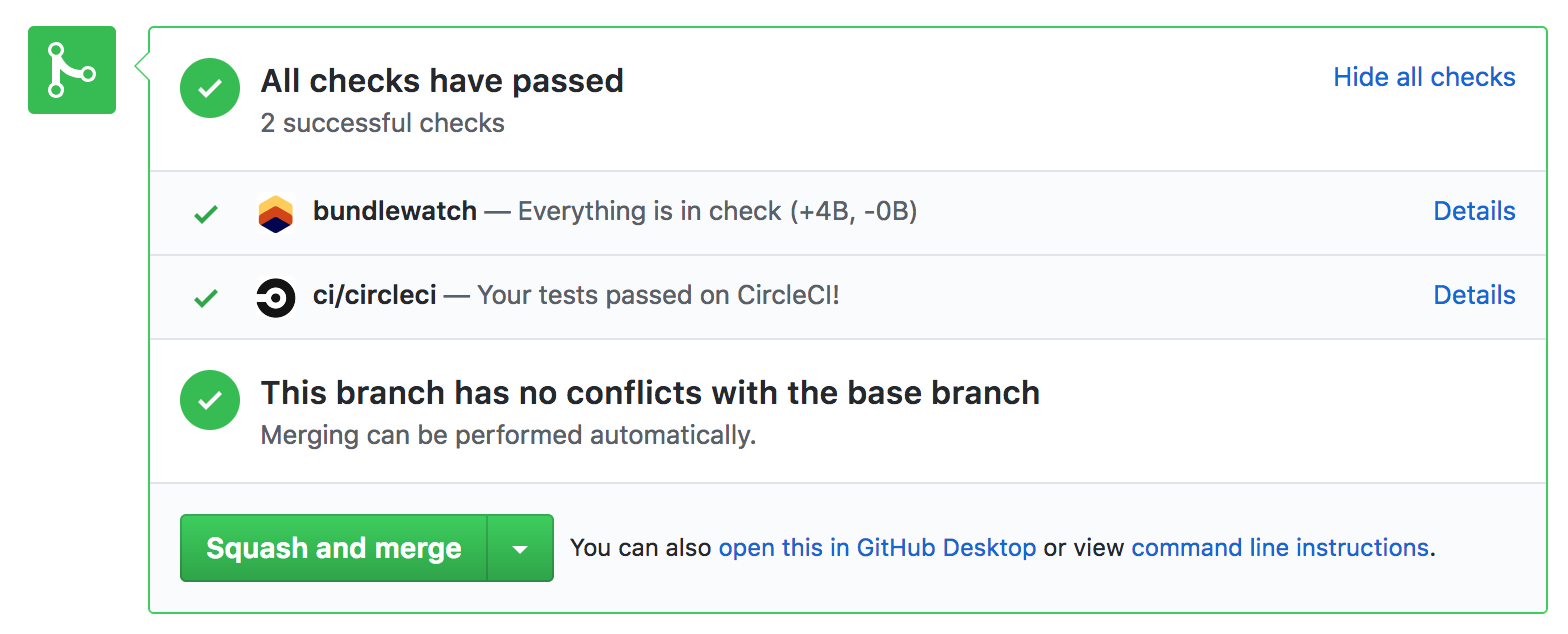
  • webpack-bundle-analyzer:

    Webpack Bundle Analyzer offers a visual representation of your bundle's contents, allowing you to see how much space each module occupies. While it does not provide monitoring over time, it gives a clear view of the current bundle size and composition, helping you make immediate optimizations.

  • source-map-explorer:

    Source Map Explorer does not monitor bundle sizes over time but rather provides a snapshot analysis of your bundles. It helps you understand the current state of your bundles, allowing you to identify large contributors and optimize them, but it does not enforce limits or provide ongoing monitoring.

  • size-limit:

    Size Limit focuses on enforcing size constraints directly in your build process. It enables you to set specific size limits for your bundles and will fail the build if those limits are exceeded, ensuring that developers are aware of size issues before they reach production.

  • bundlewatch:

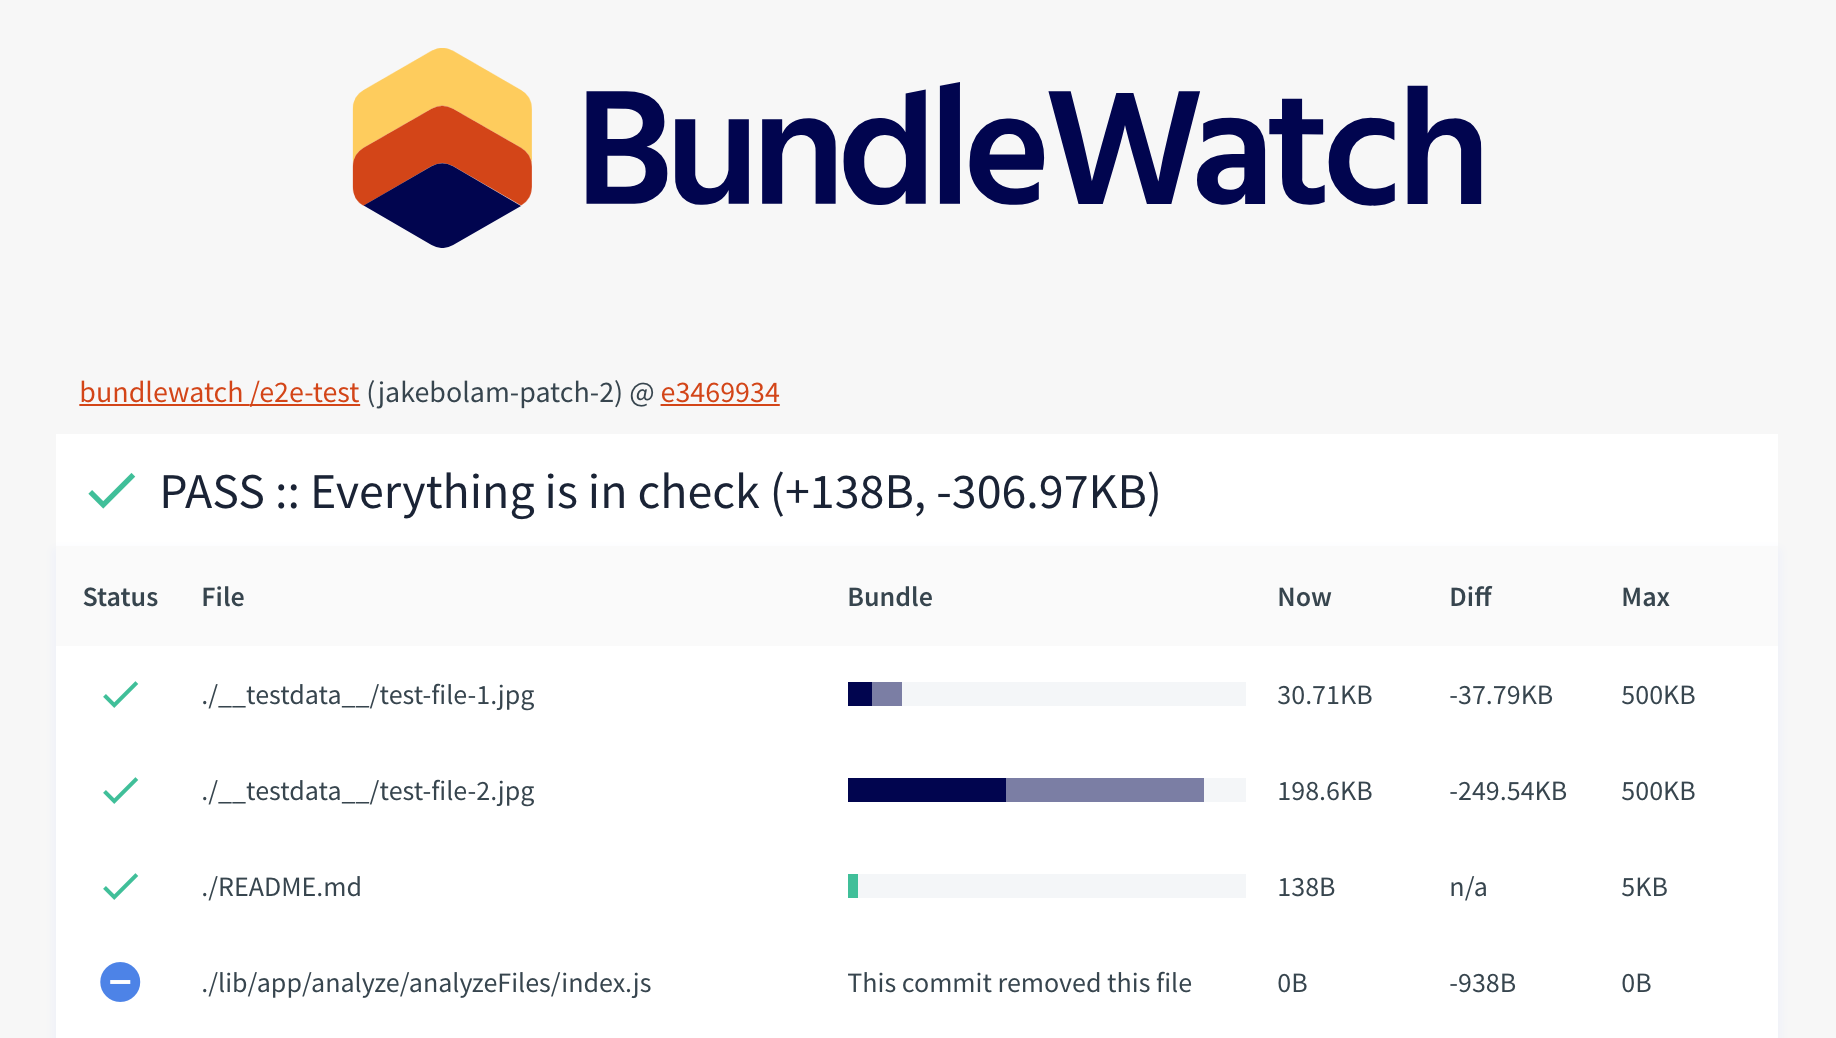
    Bundlewatch allows you to track your bundle sizes over time by providing visual reports that highlight changes in size. It integrates with CI/CD workflows to enforce size limits, alerting developers when their bundles exceed specified thresholds, thus ensuring performance remains a priority throughout the development lifecycle.

Integration with Build Tools

  • webpack-bundle-analyzer:

    Webpack Bundle Analyzer is specifically designed to work with Webpack, providing an interactive visualization of the bundle contents directly within the Webpack build process. This tight integration allows for real-time analysis during development, making it easier to optimize bundles as you code.

  • source-map-explorer:

    Source Map Explorer is primarily a standalone tool that analyzes bundles generated by various build tools. While it does not integrate directly into build processes, it can be run as part of a build script to provide insights after the build completes, making it useful for post-build analysis.

  • size-limit:

    Size Limit integrates seamlessly with various build tools and task runners, including Webpack, Rollup, and Gulp. This flexibility allows developers to enforce size limits as part of their existing build processes without significant changes to their workflow.

  • bundlewatch:

    Bundlewatch can be easily integrated into CI/CD pipelines, allowing for automated checks on bundle sizes during the build process. This integration helps teams maintain performance standards without manual intervention, making it suitable for continuous development environments.

Visualization and Reporting

  • webpack-bundle-analyzer:

    Webpack Bundle Analyzer offers an interactive treemap visualization of your bundle, showing the size of each module and its dependencies. This detailed view allows developers to quickly identify large modules and optimize their code structure.

  • source-map-explorer:

    Source Map Explorer provides a detailed visual representation of your JavaScript bundles, allowing you to see how different modules contribute to the overall size. This visualization helps in identifying large dependencies and optimizing them effectively.

  • size-limit:

    Size Limit provides a straightforward output in the console, indicating whether the bundle sizes are within the specified limits. While it does not offer advanced visualization, it gives clear feedback on size constraints, which is essential for maintaining performance.

  • bundlewatch:

    Bundlewatch generates visual reports that clearly show changes in bundle sizes over time, making it easy to spot trends and regressions. This visual feedback is crucial for teams that want to maintain performance standards and understand the impact of their changes.

Ease of Use

  • webpack-bundle-analyzer:

    Webpack Bundle Analyzer is relatively easy to set up for Webpack users, as it integrates directly into the Webpack configuration. However, users unfamiliar with Webpack may need to invest some time in understanding how to configure it properly.

  • source-map-explorer:

    Source Map Explorer is also easy to use, requiring only a few commands to analyze your bundles. However, it may require some familiarity with source maps to fully leverage its capabilities, which could pose a slight learning curve for new users.

  • size-limit:

    Size Limit is designed to be easy to configure and use, with a simple setup process that allows developers to quickly enforce size limits without extensive documentation or learning curves. Its simplicity makes it a popular choice for many projects.

  • bundlewatch:

    Bundlewatch is user-friendly and straightforward to set up, requiring minimal configuration to start monitoring bundle sizes. Its integration into CI/CD pipelines is also simple, making it accessible for teams of all sizes.

Community and Support

  • webpack-bundle-analyzer:

    Webpack Bundle Analyzer benefits from a large user base due to its integration with Webpack. It has extensive documentation and community support, making it a reliable choice for developers looking for help and resources.

  • source-map-explorer:

    Source Map Explorer has a smaller but dedicated community. While it may not have as extensive documentation as some other tools, it is still actively maintained and provides essential functionality for bundle analysis.

  • size-limit:

    Size Limit has a strong community and is widely used in the JavaScript ecosystem. It is well-documented, making it easy for developers to find help and resources when needed.

  • bundlewatch:

    Bundlewatch has a growing community and is actively maintained, which means users can expect regular updates and support. Its documentation is clear, helping new users get started quickly and effectively.

How to Choose: webpack-bundle-analyzer vs source-map-explorer vs size-limit vs bundlewatch
  • webpack-bundle-analyzer:

    Use Webpack Bundle Analyzer if you are using Webpack and want an interactive visualization of your bundle's contents. It provides a detailed breakdown of the size of each module and its dependencies, helping you to identify large modules and optimize your bundle structure effectively.

  • source-map-explorer:

    Select Source Map Explorer if you need to analyze your JavaScript bundles in detail, especially to understand the contributions of individual modules and libraries. It provides a visual representation of your source maps, allowing you to pinpoint which files are contributing most to your bundle size, making it useful for debugging and optimization.

  • size-limit:

    Opt for Size Limit if your primary goal is to enforce size limits on your bundles directly within your build process. It provides a simple configuration to set size limits and can integrate seamlessly with various build tools, making it a great choice for projects that prioritize bundle size management during development.

  • bundlewatch:

    Choose Bundlewatch if you want to monitor your bundle sizes over time and enforce size limits in your CI/CD pipeline. It provides visual reports and alerts when bundle sizes exceed specified thresholds, making it ideal for teams focused on maintaining performance standards throughout development.

README for webpack-bundle-analyzer

npm node tests downloads

Webpack Bundle Analyzer

Visualize size of webpack output files with an interactive zoomable treemap.

Install

# NPM
npm install --save-dev webpack-bundle-analyzer
# Yarn
yarn add -D webpack-bundle-analyzer

Usage (as a plugin)

const BundleAnalyzerPlugin = require('webpack-bundle-analyzer').BundleAnalyzerPlugin;

module.exports = {
  plugins: [
    new BundleAnalyzerPlugin()
  ]
}

It will create an interactive treemap visualization of the contents of all your bundles.

webpack bundle analyzer zoomable treemap

This module will help you:

  1. Realize what's really inside your bundle
  2. Find out what modules make up the most of its size
  3. Find modules that got there by mistake
  4. Optimize it!

And the best thing is it supports minified bundles! It parses them to get real size of bundled modules. And it also shows their gzipped sizes!

Options (for plugin)

new BundleAnalyzerPlugin(options?: object)

|Name|Type|Description| |:--:|:--:|:----------| |analyzerMode|One of: server, static, json, disabled|Default: server. In server mode analyzer will start HTTP server to show bundle report. In static mode single HTML file with bundle report will be generated. In json mode single JSON file with bundle report will be generated. In disabled mode you can use this plugin to just generate Webpack Stats JSON file by setting generateStatsFile to true. | |analyzerHost|{String}|Default: 127.0.0.1. Host that will be used in server mode to start HTTP server.| |analyzerPort|{Number} or auto|Default: 8888. Port that will be used in server mode to start HTTP server. If analyzerPort is auto, the operating system will assign an arbitrary unused port | |analyzerUrl|{Function} called with { listenHost: string, listenHost: string, boundAddress: server.address}. server.address comes from Node.js| Default: http://${listenHost}:${boundAddress.port}. The URL printed to console with server mode.| |reportFilename|{String}|Default: report.html. Path to bundle report file that will be generated in static mode. It can be either an absolute path or a path relative to a bundle output directory (which is output.path in webpack config).| |reportTitle|{String\|function}|Default: function that returns pretty printed current date and time. Content of the HTML title element; or a function of the form () => string that provides the content.| |defaultSizes|One of: stat, parsed, gzip|Default: parsed. Module sizes to show in report by default. Size definitions section describes what these values mean.| |openAnalyzer|{Boolean}|Default: true. Automatically open report in default browser.| |generateStatsFile|{Boolean}|Default: false. If true, webpack stats JSON file will be generated in bundle output directory| |statsFilename|{String}|Default: stats.json. Name of webpack stats JSON file that will be generated if generateStatsFile is true. It can be either an absolute path or a path relative to a bundle output directory (which is output.path in webpack config).| |statsOptions|null or {Object}|Default: null. Options for stats.toJson() method. For example you can exclude sources of your modules from stats file with source: false option. See more options here. | |excludeAssets|{null\|pattern\|pattern[]} where pattern equals to {String\|RegExp\|function}|Default: null. Patterns that will be used to match against asset names to exclude them from the report. If pattern is a string it will be converted to RegExp via new RegExp(str). If pattern is a function it should have the following signature (assetName: string) => boolean and should return true to exclude matching asset. If multiple patterns are provided asset should match at least one of them to be excluded. | |logLevel|One of: info, warn, error, silent|Default: info. Used to control how much details the plugin outputs.|

Usage (as a CLI utility)

You can analyze an existing bundle if you have a webpack stats JSON file.

You can generate it using BundleAnalyzerPlugin with generateStatsFile option set to true or with this simple command:

webpack --profile --json > stats.json

If you're on Windows and using PowerShell, you can generate the stats file with this command to avoid BOM issues:

webpack --profile --json | Out-file 'stats.json' -Encoding OEM

Then you can run the CLI tool.

webpack-bundle-analyzer bundle/output/path/stats.json

Options (for CLI)

webpack-bundle-analyzer <bundleStatsFile> [bundleDir] [options]

Arguments are documented below:

bundleStatsFile

Path to webpack stats JSON file

bundleDir

Directory containing all generated bundles.

options

  -V, --version               output the version number
  -m, --mode <mode>           Analyzer mode. Should be `server`, `static` or `json`.
                              In `server` mode analyzer will start HTTP server to show bundle report.
                              In `static` mode single HTML file with bundle report will be generated.
                              In `json` mode single JSON file with bundle report will be generated. (default: server)
  -h, --host <host>           Host that will be used in `server` mode to start HTTP server. (default: 127.0.0.1)
  -p, --port <n>              Port that will be used in `server` mode to start HTTP server. Should be a number or `auto` (default: 8888)
  -r, --report <file>         Path to bundle report file that will be generated in `static` mode. (default: report.html)
  -t, --title <title>         String to use in title element of html report. (default: pretty printed current date)
  -s, --default-sizes <type>  Module sizes to show in treemap by default.
                              Possible values: stat, parsed, gzip (default: parsed)
  -O, --no-open               Don't open report in default browser automatically.
  -e, --exclude <regexp>      Assets that should be excluded from the report.
                              Can be specified multiple times.
  -l, --log-level <level>     Log level.
                              Possible values: debug, info, warn, error, silent (default: info)
  -h, --help                  output usage information

Size definitions

webpack-bundle-analyzer reports three values for sizes. defaultSizes can be used to control which of these is shown by default. The different reported sizes are:

stat

This is the "input" size of your files, before any transformations like minification.

It is called "stat size" because it's obtained from Webpack's stats object.

parsed

This is the "output" size of your files. If you're using a Webpack plugin such as Uglify, then this value will reflect the minified size of your code.

gzip

This is the size of running the parsed bundles/modules through gzip compression.

Selecting Which Chunks to Display

When opened, the report displays all of the Webpack chunks for your project. It's possible to filter to a more specific list of chunks by using the sidebar or the chunk context menu.

Sidebar

The Sidebar Menu can be opened by clicking the > button at the top left of the report. You can select or deselect chunks to display under the "Show chunks" heading there.

Chunk Context Menu

The Chunk Context Menu can be opened by right-clicking or Ctrl-clicking on a specific chunk in the report. It provides the following options:

  • Hide chunk: Hides the selected chunk
  • Hide all other chunks: Hides all chunks besides the selected one
  • Show all chunks: Un-hides any hidden chunks, returning the report to its initial, unfiltered view

Troubleshooting

I don't see gzip or parsed sizes, it only shows stat size

It happens when webpack-bundle-analyzer analyzes files that don't actually exist in your file system, for example when you work with webpack-dev-server that keeps all the files in RAM. If you use webpack-bundle-analyzer as a plugin you won't get any errors, however if you run it via CLI you get the error message in terminal:

Error parsing bundle asset "your_bundle_name.bundle.js": no such file
No bundles were parsed. Analyzer will show only original module sizes from stats file.

To get more information about it you can read issue #147.

Other tools

  • Statoscope - Webpack bundle analyzing tool to find out why a certain module was bundled (and more features, including interactive treemap)

Maintainers


Yuriy Grunin

Vesa Laakso

Contributing

Check out CONTRIBUTING.md for instructions on contributing :tada: