cytoscape vs d3-graphviz vs dagre-d3 vs gojs vs vis-network
Graph Visualization Libraries
cytoscaped3-graphvizdagre-d3gojsvis-networkSimilar Packages:

Graph Visualization Libraries

Graph visualization libraries in JavaScript provide tools for creating interactive and visually appealing representations of graphs, networks, and hierarchical data. These libraries help developers visualize complex relationships between nodes and edges, making it easier to analyze and understand data structures. They offer various features such as customizable layouts, animations, and interactivity, which can be used in applications like social network analysis, data flow visualization, and organizational charts. cytoscape is a powerful library for graph theory and network visualization, d3-graphviz integrates Graphviz with D3.js for rendering graphs from DOT language, dagre-d3 focuses on directed acyclic graph layouts, gojs is a feature-rich library for interactive diagrams, and vis-network provides easy-to-use network visualization with dynamic data support.

Npm Package Weekly Downloads Trend

3 Years

Github Stars Ranking

Stat Detail

Package
Downloads
Stars
Size
Issues
Publish
License
cytoscape010,8835.67 MB267 months agoMIT
d3-graphviz01,7932.92 MB232 years agoBSD-3-Clause
dagre-d302,959-2176 years agoMIT
gojs08,4019.68 MB14 days agoSEE LICENSE IN license.html
vis-network03,52982.9 MB3446 months ago(Apache-2.0 OR MIT)

Feature Comparison: cytoscape vs d3-graphviz vs dagre-d3 vs gojs vs vis-network

Graph Theory and Network Analysis

  • cytoscape:

    cytoscape is designed for graph theory and network analysis, providing a wide range of algorithms and tools for analyzing graph structures. It supports various types of graphs, including directed, undirected, and weighted graphs, making it a versatile choice for complex network analysis.

  • d3-graphviz:

    d3-graphviz focuses on rendering graphs using the Graphviz layout engine, which is based on graph theory principles. However, it does not provide built-in algorithms for network analysis, as its primary purpose is visualization.

  • dagre-d3:

    dagre-d3 specializes in directed acyclic graphs (DAGs) and provides algorithms for layout and visualization. It is particularly useful for visualizing hierarchical structures and dependencies but does not offer comprehensive network analysis features.

  • gojs:

    gojs provides tools for creating and visualizing graphs and networks, but it does not focus on graph theory or network analysis. Its strength lies in creating interactive diagrams with customizable layouts and behaviors.

  • vis-network:

    vis-network is designed for visualizing networks and graphs, but it does not provide advanced graph theory or network analysis features. It focuses on rendering and interactivity, making it suitable for visual exploration of network data.

Graph Layout and Visualization

  • cytoscape:

    cytoscape offers a variety of built-in layout algorithms, including force-directed, circular, grid, and hierarchical layouts. It also allows for custom layouts and provides tools for visualizing graphs with customizable styles, colors, and shapes.

  • d3-graphviz:

    d3-graphviz leverages the Graphviz layout engine, which provides high-quality layouts for graphs based on the DOT language. It is ideal for visualizing complex graphs with precise control over node and edge positioning.

  • dagre-d3:

    dagre-d3 provides automatic layout for directed acyclic graphs, focusing on hierarchical and layered layouts. It is particularly effective for visualizing flowcharts, dependency graphs, and organizational charts.

  • gojs:

    gojs offers highly customizable layouts for graphs and diagrams, including tree, force-directed, and grid layouts. It also supports interactive features like drag-and-drop, resizing, and linking, making it a powerful tool for creating dynamic visualizations.

  • vis-network:

    vis-network provides simple and intuitive layouts for network visualization, including hierarchical, force-directed, and circular layouts. It supports dynamic data updates and allows for basic customization of node and edge styles.

Interactivity and Customization

  • cytoscape:

    cytoscape provides extensive interactivity features, including zooming, panning, and node selection. It also supports custom event handling and allows for deep customization of graph appearance and behavior through CSS-like styling and JavaScript APIs.

  • d3-graphviz:

    d3-graphviz integrates D3.js interactivity features, allowing for zooming, panning, and animated transitions. It also supports customization of graph elements through D3.js, enabling developers to create interactive and visually appealing graphs.

  • dagre-d3:

    dagre-d3 offers basic interactivity features such as zooming and panning. It allows for customization of node and edge styles using SVG and CSS, but its interactivity capabilities are more limited compared to other libraries.

  • gojs:

    gojs is highly interactive, offering features like drag-and-drop, in-place editing, and real-time updates. It provides extensive customization options for nodes, links, and layouts, making it ideal for creating complex and interactive diagrams.

  • vis-network:

    vis-network supports interactive features like zooming, panning, and node selection. It allows for customization of network appearance and behavior, including support for clustering and dynamic data updates.

Integration and Extensibility

  • cytoscape:

    cytoscape is highly extensible, with a rich ecosystem of plugins and extensions for additional functionality. It can be integrated with other tools and libraries, making it suitable for complex applications that require advanced graph analysis and visualization.

  • d3-graphviz:

    d3-graphviz integrates seamlessly with D3.js, allowing for extensive customization and extension of graph visualizations. It is ideal for projects that require combining Graphviz's layout capabilities with D3.js's powerful rendering and interactivity features.

  • dagre-d3:

    dagre-d3 is built on top of D3.js, making it easy to integrate and extend. Developers can customize the layout and styling of graphs while leveraging D3.js's capabilities for creating interactive visualizations.

  • gojs:

    gojs is a standalone library with a comprehensive API for customization and extension. It supports integration with various frameworks and platforms, making it suitable for enterprise-level applications.

  • vis-network:

    vis-network is part of the larger Vis.js library, which provides a suite of visualization tools. It is designed for easy integration and allows for customization and extension of network visualizations.

Ease of Use: Code Examples

  • cytoscape:

    cytoscape has a steeper learning curve due to its extensive features and capabilities. However, it provides thorough documentation and examples to help developers get started with graph visualization and analysis.

  • d3-graphviz:

    d3-graphviz requires familiarity with both D3.js and Graphviz, which may pose a challenge for beginners. Its documentation includes examples that demonstrate how to create and customize graphs using the DOT language and D3.js.

  • dagre-d3:

    dagre-d3 is relatively easy to use for creating directed acyclic graphs, especially for developers familiar with D3.js. Its documentation provides clear examples of how to implement DAG layouts and customize their appearance.

  • gojs:

    gojs offers comprehensive documentation and examples, but its complexity may require time to fully understand and utilize all features. It is well-suited for developers who need to create advanced and interactive diagrams.

  • vis-network:

    vis-network is user-friendly and easy to implement, with straightforward APIs and good documentation. It is ideal for developers who need to quickly create network visualizations with minimal setup.

How to Choose: cytoscape vs d3-graphviz vs dagre-d3 vs gojs vs vis-network

  • cytoscape:

    Choose cytoscape if you need a comprehensive solution for graph theory and network analysis with a wide range of features, including support for large graphs, various layout algorithms, and extensive customization options.

  • d3-graphviz:

    Choose d3-graphviz if you want to leverage the power of Graphviz for graph layout while using D3.js for rendering and interactivity. It is ideal for projects that require precise control over graph layouts using the DOT language.

  • dagre-d3:

    Choose dagre-d3 if you need to create directed acyclic graphs (DAGs) with automatic layout capabilities. It is particularly useful for visualizing hierarchical data, flowcharts, and dependency graphs.

  • gojs:

    Choose gojs if you require a commercial-grade library with advanced features for creating interactive diagrams, flowcharts, and organizational charts. It offers extensive customization, drag-and-drop functionality, and support for complex interactions.

  • vis-network:

    Choose vis-network if you need a simple and easy-to-use library for visualizing networks with support for dynamic data, clustering, and basic interactivity. It is suitable for projects that require quick implementation and lightweight visualizations.

README for cytoscape

GitHub repo Ask a question with Phind News and tutorials License npm DOI npm installs Automated tests Extensions Cloudflare

Created at the University of Toronto and published in Oxford Bioinformatics (2016, 2023).
Authored by: Max Franz, Christian Lopes, Dylan Fong, Mike Kucera, ..., Gary Bader

Cytoscape.js

Graph theory (network) library for visualisation and analysis : https://js.cytoscape.org

Description

Cytoscape.js is a fully featured graph theory library. Do you need to model and/or visualise relational data, like biological data or social networks? If so, Cytoscape.js is just what you need.

Cytoscape.js contains a graph theory model and an optional renderer to display interactive graphs. This library was designed to make it as easy as possible for programmers and scientists to use graph theory in their apps, whether it's for server-side analysis in a Node.js app or for a rich user interface.

You can get started with Cytoscape.js with one line:

var cy = cytoscape({ elements: myElements, container: myDiv });

Learn more about the features of Cytoscape.js by reading its documentation.

Example

The Tokyo railway stations network can be visualised with Cytoscape:

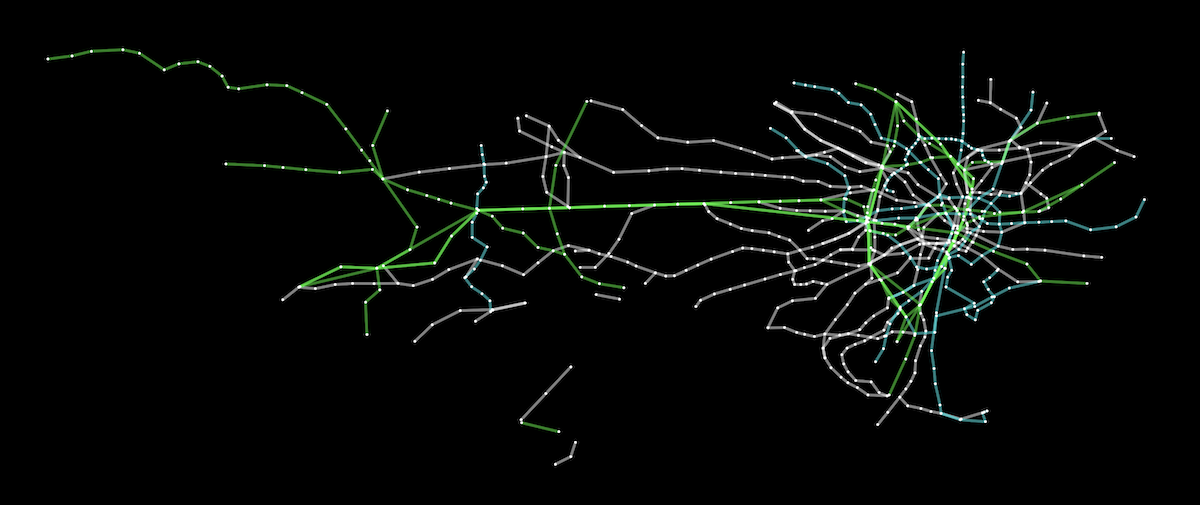
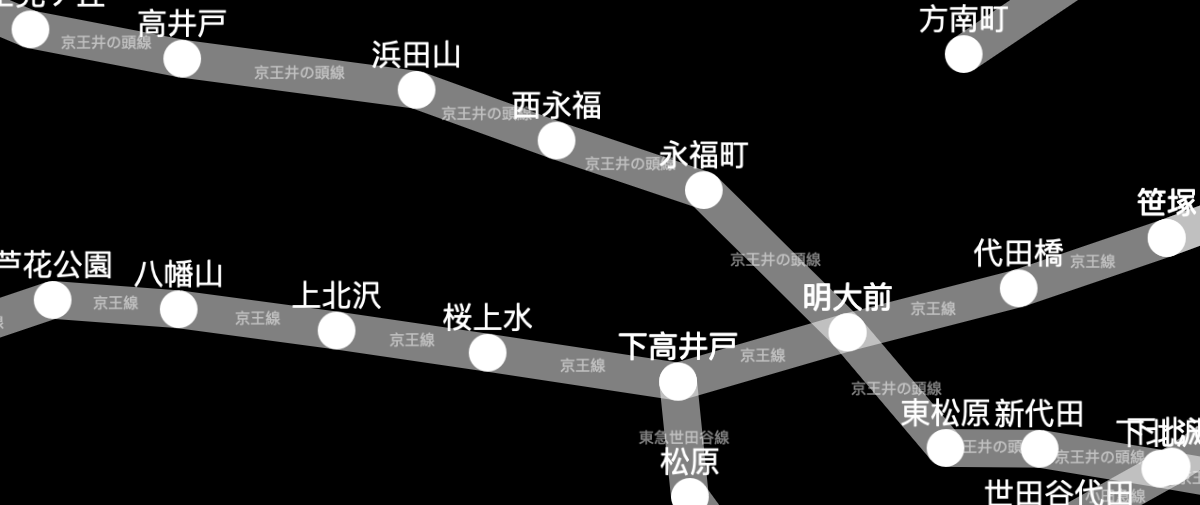
A live demo and source code are available for the Tokyo railway stations graph. More demos are available in the documentation.

Documentation

You can find the documentation and downloads on the project website.

Roadmap

Future versions of Cytoscape.js are planned in the milestones of the Github issue tracker. You can use the milestones to see what's currently planned for future releases.

Contributing to Cytoscape.js

Would you like to become a Cytoscape.js contributor? You can contribute in technical roles (e.g. features, testing) or non-technical roles (e.g. documentation, outreach), depending on your interests. Get in touch with us by posting a GitHub discussion.

For the mechanics of contributing a pull request, refer to CONTRIBUTING.md.

Feature releases are made monthly, while patch releases are made weekly. This allows for rapid releases of first- and third-party contributions.

Citation

To cite Cytoscape.js in a paper, please cite the Oxford Bioinformatics issue:

Cytoscape.js: a graph theory library for visualisation and analysis

Franz M, Lopes CT, Huck G, Dong Y, Sumer O, Bader GD

Bioinformatics (2016) 32 (2): 309-311 first published online September 28, 2015 doi:10.1093/bioinformatics/btv557 (PDF)

Build dependencies

Install node and npm. Run npm install before using npm run.

Build instructions

Run npm run <target> in the console. The main targets are:

Building:

  • build: do all builds of the library (umd, min, umd, esm)
  • build:min : do the unminified build with bundled dependencies (for simple html pages, good for novices)
  • build:umd : do the umd (cjs/amd/globals) build
  • build:esm : do the esm (ES 2015 modules) build
  • clean : clean the build directory
  • docs : build the docs into documentation
  • release : build all release artifacts
  • watch : automatically build lib for debugging (with sourcemap, no babel, very quick)
    • good for general testing on debug/index.html
    • served on http://localhost:8080 or the first available port thereafter, with livereload on debug/index.html
  • watch:babel : automatically build lib for debugging (with sourcemap, with babel, a bit slower)
    • good for testing performance or for testing out of date browsers
    • served on http://localhost:8080 or the first available port thereafter, with livereload on debug/index.html
  • watch:umd : automatically build prod umd bundle (no sourcemap, with babel)
    • good for testing cytoscape in another project (with a "cytoscape": "file:./path/to/cytoscape" reference in your project's package.json)
    • no http server
  • dist : update the distribution js for npm etc.

Testing:

The default test scripts run directly against the source code. Tests can alternatively be run on a built bundle. The library can be built on node>=6, but the library's bundle can be tested on node>=0.10.

  • test : run all testing & linting
  • test:js : run the mocha tests on the public API of the lib (directly on source files)
    • npm run test:js -- -g "my test name" runs tests on only the matching test cases
  • test:build : run the mocha tests on the public API of the lib (on a built bundle)
    • npm run build should be run beforehand on a recent version of node
    • npm run test:build -- -g "my test name" runs build tests on only the matching test cases
  • test:modules : run unit tests on private, internal API
    • npm run test:modules -- -g "my test name" runs modules tests on only the matching test cases
  • lint : lint the js sources via eslint
  • benchmark : run all benchmarks
  • benchmark:single : run benchmarks only for the suite specified in benchmark/single

Release instructions

Background

  • Ensure that a milestone exists for the release you want to make, with all the issues for that release assigned in the milestone.
  • Bug fixes should be applied to both the master and unstable branches. PRs can go on either branch, with the patch applied to the other branch after merging.
  • When a patch release is made concurrently with a feature release, the patch release should be made first. Wait 5 minutes after the patch release completes before starting the feature release -- otherwise Zenodo doesn't pick up releases properly.

Patch version

  1. Go to Actions > Patch release
  2. Go to the 'Run workflow' dropdown
  3. [Optional] The 'master' branch should be preselected for you
  4. Press the green 'Run workflow' button
  5. Close the milestone for the release

Feature version

  1. Go to Actions > Feature release
  2. Go to the 'Run workflow' dropdown
  3. [Optional] The 'unstable' branch should be preselected for you
  4. Press the green 'Run workflow' button
  5. Close the milestone for the release
  6. Make the release announcement on the blog

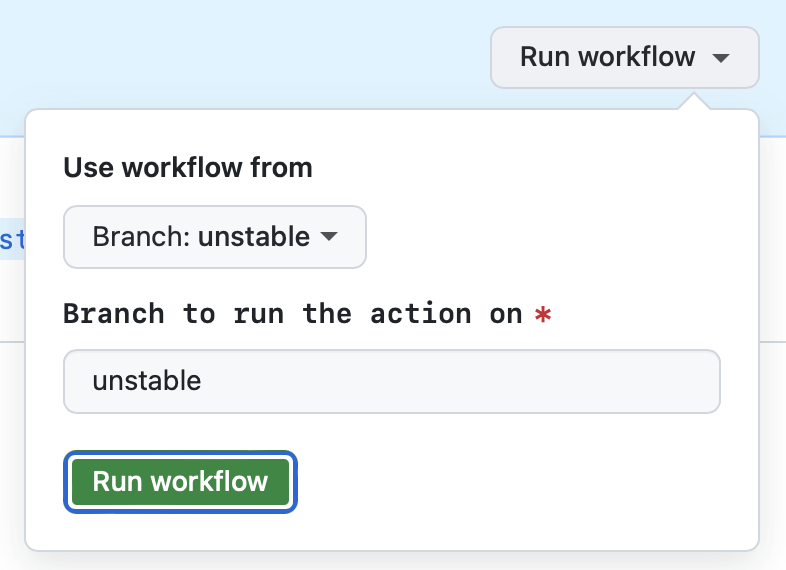
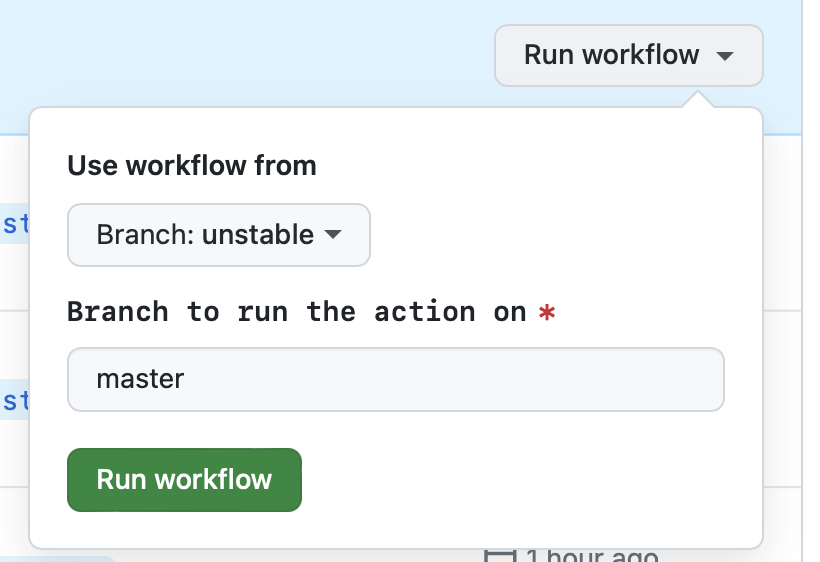
Notes on GitHub Actions UI

  • 'Use workflow from' in the GitHub UI selects the branch from which the workflow YML file is selected. Since the workflow files should usually be the same on the master and unstable branches, it shouldn't matter what's selected.
  • 'Branch to run the action on' in the GitHub UI is preselected for you. You don't need to change it.

Tests

Mocha tests are found in the test directory. The tests can be run in the browser or they can be run via Node.js (npm run test:js).