Which is Better Graph Visualization Libraries?
cytoscape vs vis-network vs d3-graphviz
1 Year
cytoscapevis-networkd3-graphvizSimilar Packages:
What's Graph Visualization Libraries?

Graph visualization libraries are essential tools for rendering complex data structures in a visual format, making it easier to understand relationships and hierarchies. They provide functionalities to create, manipulate, and display graphs in a web environment. These libraries cater to different needs, from simple visualizations to complex interactive graphs, enabling developers to present data in an engaging and informative manner. By leveraging these libraries, developers can enhance user experience and facilitate data analysis through visual representation.

NPM Package Downloads Trend
Github Stars Ranking
Stat Detail
Package
Downloads
Stars
Size
Issues
Publish
License
cytoscape789,11310,0784.63 MB162 months agoMIT
vis-network112,4103,04346.7 MB326a year ago(Apache-2.0 OR MIT)
d3-graphviz38,4641,6882.92 MB192 months agoBSD-3-Clause
Feature Comparison: cytoscape vs vis-network vs d3-graphviz

Complexity Handling

  • cytoscape: Cytoscape excels in handling complex networks with thousands of nodes and edges. It provides advanced algorithms for layout and analysis, allowing users to visualize intricate relationships effectively. This makes it suitable for applications in bioinformatics and social network analysis.
  • vis-network: vis-network is designed for ease of use and can handle moderate complexity well. It allows for quick visualizations of networks but may not perform as efficiently with very large datasets compared to Cytoscape.
  • d3-graphviz: d3-graphviz simplifies the rendering of directed graphs and flowcharts, but it may struggle with very large datasets compared to Cytoscape. It is best suited for simpler diagrams where the focus is on clarity rather than complexity.

Interactivity

  • cytoscape: Cytoscape offers extensive interactivity options, including zooming, panning, and dynamic updates to the graph. Users can interact with elements to reveal more information, making it ideal for exploratory data analysis.
  • vis-network: vis-network provides built-in interactivity features such as dragging nodes, zooming, and selecting elements. Its user-friendly interface makes it easy for users to engage with the visualized data.
  • d3-graphviz: d3-graphviz leverages D3.js to enhance interactivity, allowing for custom behaviors and animations. However, its interactivity is primarily focused on the static nature of Graphviz diagrams, which may limit dynamic interactions compared to Cytoscape.

Customization

  • cytoscape: Cytoscape allows for deep customization of graph elements, including styles, colors, and layouts. Developers can create tailored visualizations that fit specific needs, making it highly flexible for various applications.
  • vis-network: vis-network provides straightforward customization options for nodes and edges, allowing developers to easily change styles and properties. Its simplicity makes it accessible, but it may lack the depth of customization found in Cytoscape.
  • d3-graphviz: d3-graphviz offers customization through D3.js, enabling developers to manipulate SVG elements and styles. However, the customization is limited to the capabilities of Graphviz syntax, which may not be as flexible as Cytoscape.

Learning Curve

  • cytoscape: Cytoscape has a steeper learning curve due to its extensive features and capabilities. Developers may need time to familiarize themselves with its API and functionalities, especially for advanced graph analysis.
  • vis-network: vis-network is designed for quick implementation and has a gentle learning curve. Its straightforward API and documentation make it accessible for developers new to graph visualization.
  • d3-graphviz: d3-graphviz is relatively easy to learn for those already familiar with D3.js, as it builds on its concepts. However, understanding Graphviz syntax is necessary for effective use, which may pose a challenge for beginners.

Performance

  • cytoscape: Cytoscape is optimized for performance with large datasets, utilizing WebGL for rendering complex graphs efficiently. It can handle real-time updates and dynamic data well, making it suitable for applications requiring high performance.
  • vis-network: vis-network performs well with moderate-sized networks but may experience performance degradation with very large datasets. It balances usability and performance effectively for typical use cases.
  • d3-graphviz: d3-graphviz may face performance issues with very large graphs due to its reliance on SVG rendering, which can become slow with numerous elements. It is best suited for smaller to medium-sized diagrams.
How to Choose: cytoscape vs vis-network vs d3-graphviz
  • cytoscape: Choose Cytoscape if you need a robust library for complex graph analysis and visualization, especially for biological data or large networks. It offers extensive layout algorithms and supports interactive features, making it ideal for applications requiring detailed exploration of graph structures.
  • vis-network: Opt for vis-network if you need a straightforward solution for network visualization with an emphasis on ease of use and interactivity. It provides a user-friendly API and built-in features for manipulating nodes and edges, making it suitable for quick implementations and educational purposes.
  • d3-graphviz: Select d3-graphviz if you want to integrate Graphviz-style diagrams into your D3.js visualizations. It is particularly useful for rendering flowcharts and directed graphs, leveraging the power of D3 for additional interactivity and customization, while maintaining the simplicity of Graphviz syntax.
README for cytoscape

GitHub repo Ask a question with Phind News and tutorials License npm DOI npm installs Automated tests Extensions Cloudflare

Created at the University of Toronto and published in Oxford Bioinformatics (2016, 2023).
Authored by: Max Franz, Christian Lopes, Dylan Fong, Mike Kucera, ..., Gary Bader

Cytoscape.js

Graph theory (network) library for visualisation and analysis : https://js.cytoscape.org

Description

Cytoscape.js is a fully featured graph theory library. Do you need to model and/or visualise relational data, like biological data or social networks? If so, Cytoscape.js is just what you need.

Cytoscape.js contains a graph theory model and an optional renderer to display interactive graphs. This library was designed to make it as easy as possible for programmers and scientists to use graph theory in their apps, whether it's for server-side analysis in a Node.js app or for a rich user interface.

You can get started with Cytoscape.js with one line:

var cy = cytoscape({ elements: myElements, container: myDiv });

Learn more about the features of Cytoscape.js by reading its documentation.

Example

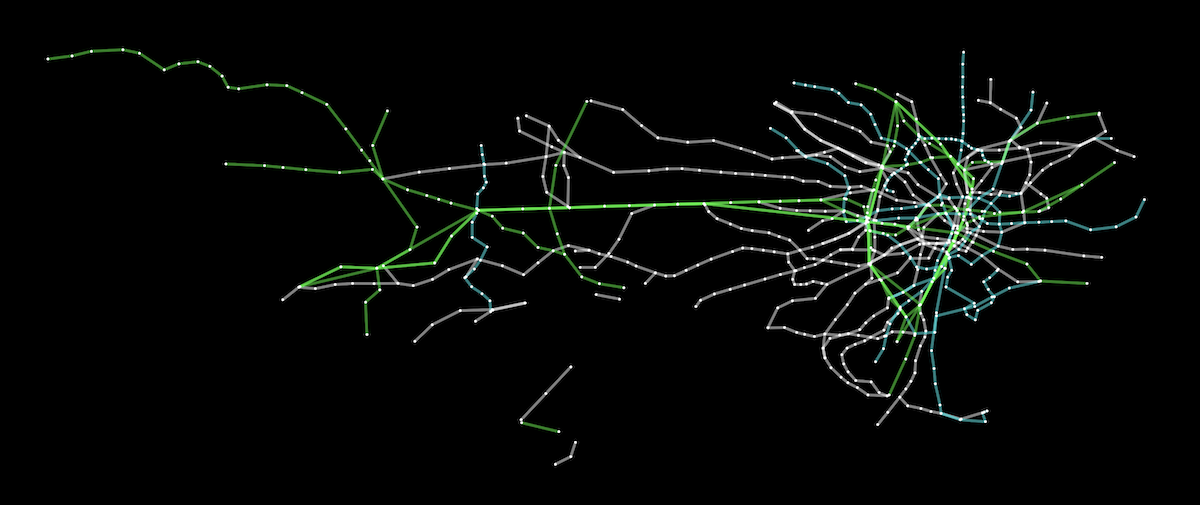
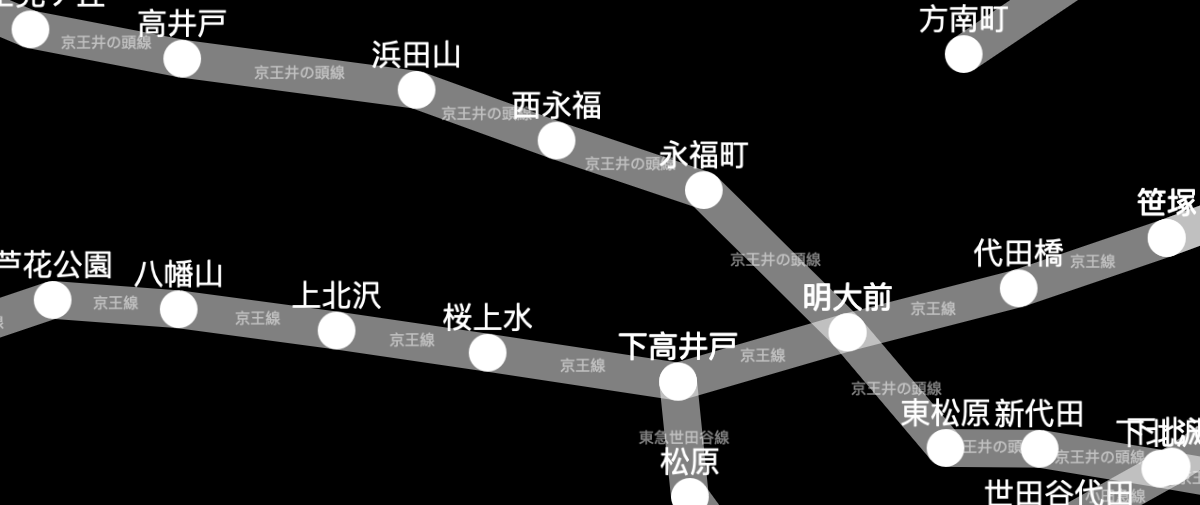
The Tokyo railway stations network can be visualised with Cytoscape:

A live demo and source code are available for the Tokyo railway stations graph. More demos are available in the documentation.

Documentation

You can find the documentation and downloads on the project website.

Roadmap

Future versions of Cytoscape.js are planned in the milestones of the Github issue tracker. You can use the milestones to see what's currently planned for future releases.

Contributing to Cytoscape.js

Would you like to become a Cytoscape.js contributor? You can contribute in technical roles (e.g. features, testing) or non-technical roles (e.g. documentation, outreach), depending on your interests. Get in touch with us by posting a GitHub discussion.

For the mechanics of contributing a pull request, refer to CONTRIBUTING.md.

Feature releases are made monthly, while patch releases are made weekly. This allows for rapid releases of first- and third-party contributions.

Citation

To cite Cytoscape.js in a paper, please cite the Oxford Bioinformatics issue:

Cytoscape.js: a graph theory library for visualisation and analysis

Franz M, Lopes CT, Huck G, Dong Y, Sumer O, Bader GD

Bioinformatics (2016) 32 (2): 309-311 first published online September 28, 2015 doi:10.1093/bioinformatics/btv557 (PDF)

Build dependencies

Install node and npm. Run npm install before using npm run.

Build instructions

Run npm run <target> in the console. The main targets are:

Building:

  • build: do all builds of the library (umd, min, umd, esm)
  • build:min : do the unminified build with bundled dependencies (for simple html pages, good for novices)
  • build:umd : do the umd (cjs/amd/globals) build
  • build:esm : do the esm (ES 2015 modules) build
  • clean : clean the build directory
  • docs : build the docs into documentation
  • release : build all release artifacts
  • watch : automatically build lib for debugging (with sourcemap, no babel, very quick)
    • good for general testing on debug/index.html
    • served on http://localhost:8080 or the first available port thereafter, with livereload on debug/index.html
  • watch:babel : automatically build lib for debugging (with sourcemap, with babel, a bit slower)
    • good for testing performance or for testing out of date browsers
    • served on http://localhost:8080 or the first available port thereafter, with livereload on debug/index.html
  • watch:umd : automatically build prod umd bundle (no sourcemap, with babel)
    • good for testing cytoscape in another project (with a "cytoscape": "file:./path/to/cytoscape" reference in your project's package.json)
    • no http server
  • dist : update the distribution js for npm etc.

Testing:

The default test scripts run directly against the source code. Tests can alternatively be run on a built bundle. The library can be built on node>=6, but the library's bundle can be tested on node>=0.10.

  • test : run all testing & linting
  • test:js : run the mocha tests on the public API of the lib (directly on source files)
    • npm run test:js -- -g "my test name" runs tests on only the matching test cases
  • test:build : run the mocha tests on the public API of the lib (on a built bundle)
    • npm run build should be run beforehand on a recent version of node
    • npm run test:build -- -g "my test name" runs build tests on only the matching test cases
  • test:modules : run unit tests on private, internal API
    • npm run test:modules -- -g "my test name" runs modules tests on only the matching test cases
  • lint : lint the js sources via eslint
  • benchmark : run all benchmarks
  • benchmark:single : run benchmarks only for the suite specified in benchmark/single

Release instructions

Background

  • Ensure that a milestone exists for the release you want to make, with all the issues for that release assigned in the milestone.
  • Bug fixes should be applied to both the master and unstable branches. PRs can go on either branch, with the patch applied to the other branch after merging.
  • When a patch release is made concurrently with a feature release, the patch release should be made first. Wait 5 minutes after the patch release completes before starting the feature release -- otherwise Zenodo doesn't pick up releases properly.

Patch version

  1. Go to Actions > Feature release
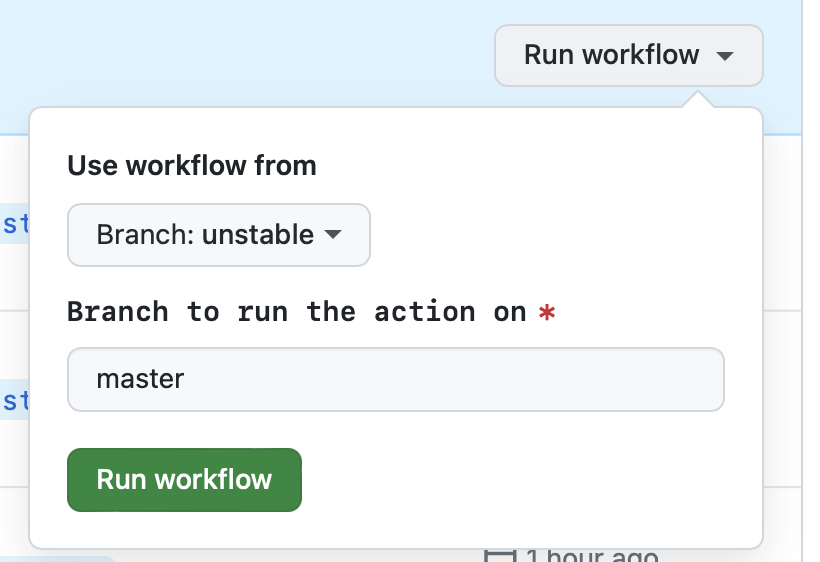
  2. Go to the 'Run workflow' dropdown
  3. [Optional] The 'master' branch should be preselected for you
  4. Press the green 'Run workflow' button
  5. Close the milestone for the release

Feature version

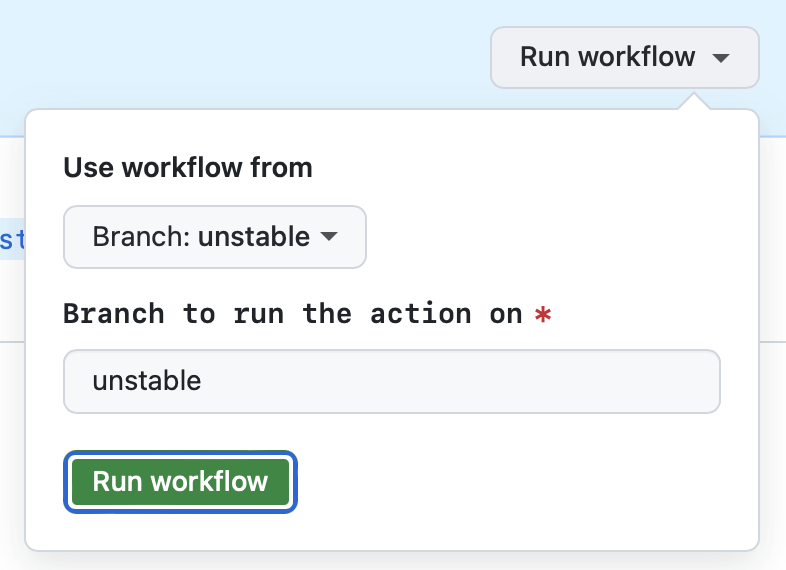
  1. Go to Actions > Feature release
  2. Go to the 'Run workflow' dropdown
  3. [Optional] The 'unstable' branch should be preselected for you
  4. Press the green 'Run workflow' button
  5. Close the milestone for the release
  6. Make the release announcement on the blog

Notes on GitHub Actions UI

  • 'Use workflow from' in the GitHub UI selects the branch from which the workflow YML file is selected. Since the workflow files should usually be the same on the master and unstable branches, it shouldn't matter what's selected.
  • 'Branch to run the action on' in the GitHub UI is preselected for you. You don't need to change it.

Tests

Mocha tests are found in the test directory. The tests can be run in the browser or they can be run via Node.js (npm run test:js).