Customization
- mapbox-gl:
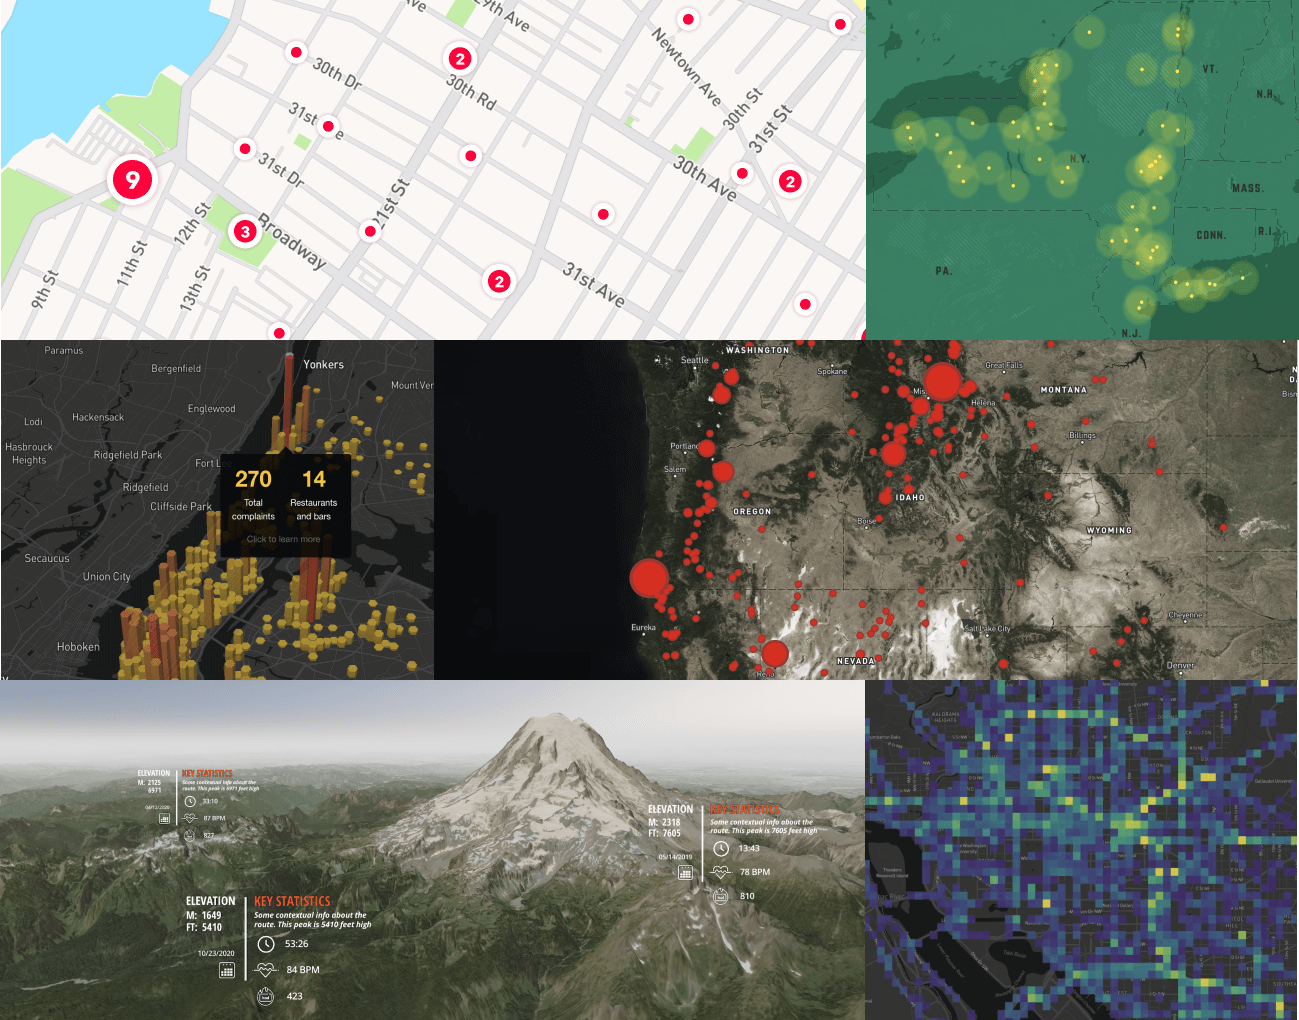
Mapbox GL JS offers a high degree of customization for map styles and layers. Developers can use Mapbox Studio to design custom map styles and integrate them into applications, allowing for visually stunning and tailored map experiences.
- d3:
D3.js offers unparalleled customization capabilities, allowing developers to create virtually any type of visualization. It provides low-level access to SVG elements, enabling detailed manipulation of styles, transitions, and interactions, but requires a strong understanding of web standards.
- deck.gl:
deck.gl allows for extensive customization of visual layers and interactions, particularly for geospatial data. Developers can create custom layers and integrate them seamlessly with existing Mapbox styles, offering flexibility in how data is presented on maps.
- leaflet:
Leaflet is designed to be simple and extensible, allowing developers to customize maps easily through plugins. While it provides basic mapping functionalities out of the box, additional features can be added through a wide range of community plugins.
- plotly.js:
Plotly.js provides a variety of customizable chart types and options, enabling developers to adjust colors, labels, and interactivity. It is particularly useful for creating dashboards where different visualizations need to be harmonized in appearance.
- react-vis:
React-Vis provides a set of customizable components that can be easily styled using props. While it is not as flexible as D3, it allows for quick adjustments to chart properties to fit the application's design requirements.
- victory:
Victory offers a modular approach to chart building, allowing developers to customize individual components easily. It supports theming and provides a consistent API for styling, making it straightforward to create visually appealing charts.
Learning Curve
- mapbox-gl:
Mapbox GL JS has a moderate learning curve, especially for developers familiar with JavaScript and web development. Its extensive documentation and examples help ease the learning process, but mastering its advanced features may take time.
- d3:
D3.js has a steep learning curve due to its complexity and the need for a solid understanding of SVG, DOM manipulation, and data binding concepts. Beginners may find it challenging but rewarding once mastered.
- deck.gl:
deck.gl has a moderate learning curve, especially for those familiar with React and WebGL. Its API is designed to be intuitive for developers who have experience with mapping libraries, but understanding WebGL concepts can be beneficial.
- leaflet:
Leaflet is beginner-friendly and easy to learn, making it an excellent choice for developers new to mapping. Its straightforward API allows for quick implementation of interactive maps with minimal setup.
- plotly.js:
Plotly.js is relatively easy to learn, especially for those with a background in data visualization. Its declarative syntax allows for quick chart creation, making it accessible for developers of all skill levels.
- react-vis:
React-Vis is designed for React developers and has a gentle learning curve. Its components are intuitive to use, and developers can quickly create visualizations without deep knowledge of the underlying principles.
- victory:
Victory is also beginner-friendly for React developers, offering a straightforward API and clear documentation. It allows for quick prototyping of charts, making it suitable for those new to data visualization.
Performance
- mapbox-gl:
Mapbox GL JS is designed for high performance, utilizing WebGL for rendering. It efficiently handles large datasets and provides smooth interactions, making it suitable for applications requiring dynamic map features.
- d3:
D3.js can become performance-intensive with large datasets due to its direct manipulation of the DOM. Developers need to optimize their code and use techniques like data joins and transitions carefully to maintain performance.
- deck.gl:
deck.gl is optimized for performance, leveraging WebGL to render large datasets efficiently. It can handle thousands of data points without significant performance degradation, making it ideal for visualizing complex geospatial data.
- leaflet:
Leaflet performs well for simple maps and moderate datasets. However, performance may decrease with a high number of markers or layers, so developers should consider optimizations like clustering for large datasets.
- plotly.js:
Plotly.js performance can vary depending on the complexity of the visualizations. While it handles moderate datasets well, very large datasets may lead to slower rendering times, requiring optimization techniques like data aggregation.
- react-vis:
React-Vis is performant for standard charting needs, but may struggle with very large datasets. Developers should consider performance implications when rendering complex visualizations with many data points.
- victory:
Victory is generally performant for typical use cases, but like React-Vis, it may face challenges with large datasets. Developers should be mindful of the number of rendered components to maintain performance.
Integration
- mapbox-gl:
Mapbox GL JS integrates well with various frameworks, including React and Angular. It provides a robust API for customizing maps and can be used alongside other libraries for enhanced functionality.
- d3:
D3.js can be integrated into any web application, but it requires manual setup for frameworks like React or Angular. Its flexibility allows it to work with various libraries, but this may involve additional complexity.
- deck.gl:
deck.gl integrates seamlessly with React and can work alongside Mapbox for enhanced mapping capabilities. Its design makes it easy to incorporate into modern web applications focused on geospatial data visualization.
- leaflet:
Leaflet is easy to integrate into any web application, including those built with frameworks like React and Angular. Its simplicity and lightweight nature make it a popular choice for adding maps to projects.
- plotly.js:
Plotly.js can be integrated into any web application and works well with frameworks like React. It provides a straightforward way to create interactive charts and dashboards, making it a versatile choice for data visualization.
- react-vis:
React-Vis is designed specifically for React applications, making integration seamless. It provides a set of components that can be easily used within React's component structure, allowing for quick visualization development.
- victory:
Victory is also tailored for React, offering a collection of components that integrate smoothly into React applications. Its modular design allows for easy customization and reuse across projects.