
ApexCharts
Modern, interactive JavaScript charts your users will love - built for dashboards, SaaS, and data-heavy UIs.


Live demos ·
Documentation ·
License

Why ApexCharts
- 16+ chart types out of the box — line, area, bar, column, pie, donut, radar, heatmap, treemap, candlestick, boxplot, funnel, pyramid, gauge and more
- SSR support for Next.js, Nuxt, SvelteKit, Astro, and other meta-frameworks — render real SVG on the server, hydrate on the client
- Tree-shakable — import only the chart types and features you need; typical bundles are 30–60% smaller than the full build
- TypeScript-first — full type definitions ship with the package, no
@types/* install needed
- Zero runtime dependencies — no React/Vue/D3 required; works in any framework or vanilla JS
- Accessibility — keyboard navigation and ARIA support built in
- Free for most users — see License
Install
npm install apexcharts
Or via CDN:
<script src="https://cdn.jsdelivr.net/npm/apexcharts"></script>
Quick start
import ApexCharts from 'apexcharts'

const chart = new ApexCharts(document.querySelector('#chart'), {
  chart: { type: 'bar' },
  series: [{ name: 'Sales', data: [30, 40, 35, 50, 49, 60, 70, 91, 125] }],
  xaxis: { categories: [1991, 1992, 1993, 1994, 1995, 1996, 1997, 1998, 1999] }
})

chart.render()
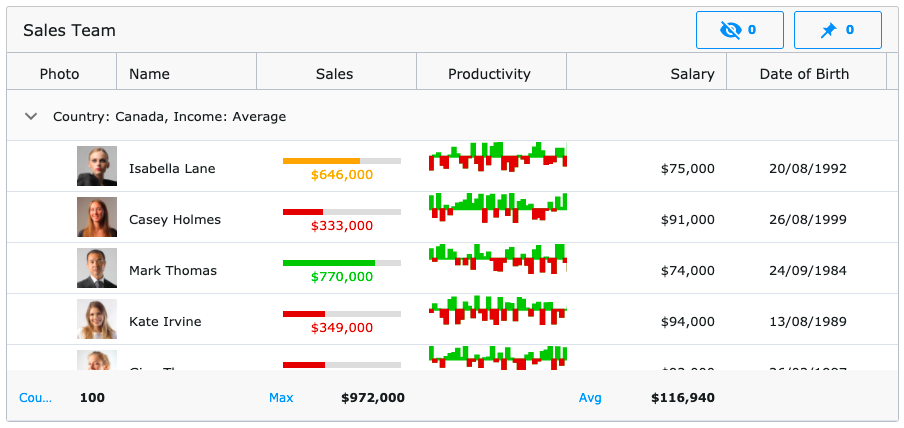
Browse 100+ ready-to-use samples — copy, paste, ship.
Chart types
Combine any of the above as mixed/combo charts, stacked variants, sparklines, or synchronized multi-chart layouts.
Framework wrappers
Official:
Community:
Server-side rendering
Render chart HTML on the server, then hydrate in the browser. Works with Next.js, Nuxt, SvelteKit, Astro, Remix, and any Node-based framework.
// Server
import ApexCharts from 'apexcharts/ssr'

const chartHTML = await ApexCharts.renderToHTML({
  chart: { type: 'bar' },
  series: [{ data: [30, 40, 35, 50, 49, 60, 70, 91, 125] }],
  xaxis: { categories: [1991, 1992, 1993, 1994, 1995, 1996, 1997, 1998, 1999] }
}, { width: 500, height: 300 })

// Returns hydration-ready HTML with embedded SVG
// Client
import ApexCharts from 'apexcharts/client'

ApexCharts.hydrate(document.getElementById('my-chart'))
// or: ApexCharts.hydrateAll()
No more dynamic(() => import(...), { ssr: false }) workarounds — the chart renders on the server and becomes interactive on hydration.
Tree-shaking — ship only what you use
By default import ApexCharts from 'apexcharts' includes everything. For smaller bundles, import from apexcharts/core and add only what you need:
import ApexCharts from 'apexcharts/core'   // bare class — no chart types, no features

// Chart types (match the value of chart.type)
import 'apexcharts/line'
import 'apexcharts/bar'
// import 'apexcharts/area'
// import 'apexcharts/scatter'

// Optional features
import 'apexcharts/features/legend'
import 'apexcharts/features/toolbar'      // zoom/pan toolbar
// import 'apexcharts/features/exports'      // SVG/PNG/CSV download
// import 'apexcharts/features/annotations'
// import 'apexcharts/features/keyboard'     // keyboard navigation
See the tree-shaking guide for the complete list of entry points.
Browser support
ApexCharts works in all modern evergreen browsers (Chrome, Firefox, Safari, Edge). For server-side rendering, Node.js 18+ is required.
Documentation
Contributing
npm install
npm run dev     # vite build --watch
npm test        # e2e + unit
See CONTRIBUTING.md for setup, coding conventions, and PR guidelines.
License
ApexCharts uses a revenue-based license:
- Free for individuals, and organizations with under $2M USD in annual gross revenue — including commercial and internal use. No registration required.
- Commercial license required for organizations at or above $2M USD annual gross revenue.
Full terms: apexcharts.com/license
Need an enterprise data grid?
We've partnered with Infragistics, creators of Ignite UI — high-performance data grids that handle unlimited rows and columns, with custom templates and real-time updates.
Available for:
Angular · React · Blazor · Web Components · jQuery
Contact