Application Monitoring and Observability Tools for Node.js
These eight packages represent different approaches to application monitoring, logging, and observability in the JavaScript ecosystem. datadog-metrics, elastic-apm-node, newrelic, and prom-client focus on metrics and performance tracking. loggly specializes in log aggregation and search. opentracing provides a vendor-neutral tracing API. raygun and sentry concentrate on error tracking and crash reporting. While most are Node.js-focused, several offer browser counterparts for full-stack observability.
Npm Package Weekly Downloads Trend
Github Stars Ranking
Stat Detail
Application Monitoring and Observability Tools: A Technical Deep-Dive
When building production JavaScript applications, you need visibility into what's happening — errors, performance bottlenecks, and system health. The eight packages we're comparing (datadog-metrics, elastic-apm-node, loggly, newrelic, opentracing, prom-client, raygun, sentry) each solve different parts of the observability puzzle. Let's break down how they work and when to use each one.
🎯 Primary Focus: What Each Tool Actually Does
These packages fall into three main categories:
Metrics & Performance Tracking — datadog-metrics, elastic-apm-node, newrelic, prom-client
Log Aggregation — loggly
Error Tracking — raygun, sentry
Distributed Tracing — opentracing
Understanding this distinction matters because you'll often need tools from multiple categories for complete observability.
📊 Metrics Collection: Four Different Approaches
datadog-metrics sends custom metrics to Datadog's DogStatsD server. You define what to measure and push it to their infrastructure.
// datadog-metrics: Push custom metrics
const metrics = require('datadog-metrics');
metrics.init({ host: 'localhost', prefix: 'myapp.' });

const gauge = metrics.gauge('requests.per.second');
gauge(150);
elastic-apm-node automatically instruments your Node.js app and sends performance data to Elastic APM. Less manual setup, more automatic coverage.
// elastic-apm-node: Automatic instrumentation
const apm = require('elastic-apm-node').start({
  serviceName: 'my-app',
  serverUrl: 'http://localhost:8200'
});

// Transactions are captured automatically
app.get('/users', (req, res) => {
  // APM tracks this request automatically
  res.json({ users: [] });
});
newrelic also provides automatic instrumentation but sends data to New Relic's commercial platform. Requires minimal code changes.
// newrelic: Auto-instrumentation via require
require('newrelic');

const express = require('express');
const app = express();

// New Relic automatically tracks requests, errors, and performance
app.get('/products', (req, res) => {
  res.json({ products: [] });
});
prom-client exposes metrics in Prometheus format for you to scrape. You control the metrics server and storage.
// prom-client: Expose metrics endpoint
const client = require('prom-client');
const register = new client.Registry();

const requestCounter = new client.Counter({
  name: 'http_requests_total',
  help: 'Total HTTP requests'
});

register.registerMetric(requestCounter);

app.get('/metrics', async (req, res) => {
  res.set('Content-Type', register.contentType);
  res.end(await register.metrics());
});
🐛 Error Tracking: Sentry vs Raygun
sentry captures errors with rich context — stack traces, user data, breadcrumbs, and performance data. Has excellent browser and Node.js support.
// sentry: Capture exceptions with context
const Sentry = require('@sentry/node');

Sentry.init({
  dsn: 'https://examplePublicKey@o0.ingest.sentry.io/0',
  environment: 'production'
});

try {
  riskyOperation();
} catch (error) {
  Sentry.captureException(error, {
    tags: { feature: 'checkout' },
    user: { id: '123' }
  });
}
raygun also captures errors but with a simpler setup. Good for teams that want error tracking without the full observability platform.
// raygun: Simple error reporting
const raygun = require('raygun');
const client = new raygun.Client();

client.init({ apiKey: 'YOUR_API_KEY' });

client.send(new Error('Something went wrong'), {
  tags: ['production'],
  user: { identifier: 'user-123' }
});
📝 Log Aggregation: Loggly's Approach
loggly sends logs to their cloud service for search and analysis. Works with popular logging libraries like Winston.
// loggly: Send logs to cloud
const winston = require('winston');
const Loggly = require('winston-loggly-bulk');

const logger = winston.createLogger({
  transports: [
    new winston.transports.Loggly({
      token: 'YOUR_TOKEN',
      subdomain: 'your-subdomain',
      tags: ['NodeJS']
    })
  ]
});

logger.info('Application started');
🔗 Distributed Tracing: OpenTracing's Role
opentracing provides a vendor-neutral API for distributed tracing. You need to pair it with a specific implementation (like Jaeger or Zipkin).
// opentracing: Vendor-neutral tracing API
const opentracing = require('opentracing');

const tracer = new opentracing.Tracer();
const span = tracer.startSpan('database-query');

span.setTag('db.type', 'postgresql');

// Do database work...

span.finish();
⚠️ Important Note: OpenTracing has been merged into OpenTelemetry. For new projects, use @opentelemetry/api instead. OpenTracing is in maintenance mode.
// OpenTelemetry (recommended for new projects)
const api = require('@opentelemetry/api');

const tracer = api.trace.getTracer('my-app');
const span = tracer.startSpan('database-query');

// ... work ...

span.end();
🌐 Frontend vs Backend: Critical Distinction
Most packages listed here are Node.js/backend focused. For frontend monitoring, you need different packages:
| Backend Package | Frontend Alternative |
|---|---|
datadog-metrics | @datadog/browser-rum |
elastic-apm-node | @elastic/apm-rum |
newrelic | newrelic-browser |
sentry (Node) | @sentry/browser |
raygun (Node) | raygun4js |
// @sentry/browser: Frontend error tracking
import * as Sentry from '@sentry/browser';

Sentry.init({
  dsn: 'https://examplePublicKey@o0.ingest.sentry.io/0'
});

Sentry.captureMessage('Frontend error occurred');
⚠️ Deprecation and Maintenance Status
opentracing — In maintenance mode. OpenTelemetry has replaced it. Do not use for new projects.
loggly — SolarWinds (owner) has shifted focus. Evaluate current maintenance before committing to new projects.
Recommended for new projects: sentry, prom-client, elastic-apm-node
Evaluate carefully: loggly, opentracing
Commercial solutions: datadog-metrics, newrelic, raygun (require paid subscriptions for full features)
🔧 Integration Complexity Comparison
Lowest Setup Effort — newrelic, sentry
- Drop in the package
- Add API key
- Start receiving data
// newrelic: Minimal setup
require('newrelic'); // That's it for basic tracking

// sentry: Simple initialization
Sentry.init({ dsn: 'your-dsn' });
Medium Setup Effort — datadog-metrics, elastic-apm-node, raygun
- Need infrastructure configuration
- Some manual instrumentation for custom metrics
// datadog-metrics: Configure connection
metrics.init({
  host: 'statsd-host',
  prefix: 'myapp.'
});
Highest Setup Effort — prom-client, opentracing
- Need to run your own infrastructure (Prometheus, Jaeger, etc.)
- More configuration but more control
// prom-client: Full control over metrics
const register = new client.Registry();
// Define each metric manually
// Set up scraping endpoint
// Configure Prometheus server separately
💰 Cost Considerations
Open Source / Self-Hosted — prom-client, opentracing
- No licensing costs
- You pay for infrastructure and maintenance
Freemium — sentry, raygun
- Free tiers available
- Paid plans for higher volume or advanced features
Commercial — datadog-metrics, newrelic, elastic-apm-node (with Elastic Cloud)
- Typically require paid subscriptions for production use
elastic-apm-nodecan be self-hosted with Elastic Stack
Uncertain — loggly
- Pricing and maintenance status should be verified before commitment
📋 Feature Comparison Matrix
| Package | Auto-Instrument | Custom Metrics | Error Tracking | Log Aggregation | Distributed Tracing | Frontend Support |
|---|---|---|---|---|---|---|
datadog-metrics | ❌ | ✅ | ❌ | ❌ | ❌ | Via separate SDK |
elastic-apm-node | ✅ | ✅ | ✅ | ❌ | ✅ | Via @elastic/apm-rum |
loggly | ❌ | ❌ | ❌ | ✅ | ❌ | Via separate SDK |
newrelic | ✅ | ✅ | ✅ | ✅ | ✅ | Via newrelic-browser |
opentracing | ❌ | ❌ | ❌ | ❌ | ✅ | Via separate SDK |
prom-client | ❌ | ✅ | ❌ | ❌ | ❌ | Via separate SDK |
raygun | ❌ | ❌ | ✅ | ❌ | ❌ | Via raygun4js |
sentry | ✅ | ✅ | ✅ | ❌ | ✅ | Via @sentry/browser |
🎯 Real-World Selection Scenarios
Scenario 1: Startup with Limited Budget
Best choice: sentry + prom-client
- Sentry's free tier covers error tracking
- prom-client gives you metrics without vendor lock-in
- Total cost: $0 for infrastructure you manage yourself
// Combined setup
import * as Sentry from '@sentry/node';
const client = require('prom-client');

Sentry.init({ dsn: process.env.SENTRY_DSN });

const httpRequestDuration = new client.Histogram({
  name: 'http_request_duration_seconds',
  help: 'Duration of HTTP requests'
});
Scenario 2: Enterprise with Existing Datadog Investment
Best choice: datadog-metrics + sentry
- Leverage existing Datadog dashboards
- Sentry for detailed error tracking (better DX than Datadog Errors)
// datadog-metrics: Send business metrics
metrics.gauge('checkout.completed', 1, ['environment:production']);

// sentry: Track errors separately
Sentry.captureException(error);
Scenario 3: Full Elastic Stack Shop
Best choice: elastic-apm-node + loggly (or Elastic logs)
- Unified observability across logs, metrics, and traces
- Single platform for all monitoring data
// elastic-apm-node: Full APM
const apm = require('elastic-apm-node').start({
  serviceName: 'my-service',
  captureBody: 'all'
});
Scenario 4: Maximum Control, Self-Hosted Everything
Best choice: prom-client + opentelemetry (not opentracing)
- Complete ownership of monitoring infrastructure
- No vendor dependencies
// prom-client + OpenTelemetry
const client = require('prom-client');
const api = require('@opentelemetry/api');

// Metrics via Prometheus
// Tracing via OpenTelemetry
🚫 Common Mistakes to Avoid
Mistake 1: Using backend packages for frontend monitoring
// WRONG: This is Node.js only
const apm = require('elastic-apm-node'); // Won't work in browser

// RIGHT: Use browser SDK
import { init } from '@elastic/apm-rum';
init({ serviceName: 'my-app' });
Mistake 2: Choosing OpenTracing for new projects
// WRONG: OpenTracing is in maintenance
const opentracing = require('opentracing');

// RIGHT: Use OpenTelemetry
const api = require('@opentelemetry/api');
Mistake 3: Not sampling in high-traffic apps
// WRONG: Send every transaction
Sentry.init({ dsn: '...', tracesSampleRate: 1.0 });

// RIGHT: Sample appropriately
Sentry.init({
  dsn: '...',
  tracesSampleRate: 0.1 // 10% of transactions
});
💡 Final Recommendations
For most teams starting fresh: sentry provides the best balance of features, ease of use, and cost. Add prom-client if you need custom metrics.
For enterprises with budget: newrelic or datadog-metrics offer comprehensive platforms with less operational overhead.
For self-hosted enthusiasts: prom-client + OpenTelemetry gives maximum control without vendor lock-in.
Avoid for new projects: opentracing (use OpenTelemetry instead), loggly (verify current maintenance status first).
Remember: These are primarily backend tools. For complete observability, pair them with their frontend counterparts to get full-stack visibility.
How to Choose: datadog-metrics vs sentry vs elastic-apm-node vs loggly vs newrelic vs opentracing vs prom-client vs raygun
- datadog-metrics:
Choose
datadog-metricsif your team already uses Datadog for infrastructure monitoring and you need tight integration with their ecosystem. It works best for backend metrics collection in Node.js services. Not suitable for browser-side monitoring — use @datadog/browser-sdk instead for frontend applications. - sentry:
Choose
sentryif you want the most comprehensive error tracking with strong frontend support, performance monitoring, and release tracking. It has excellent JavaScript/TypeScript integration and active maintenance. Best for teams that prioritize developer experience and want both error and performance monitoring in one platform. - elastic-apm-node:
Choose
elastic-apm-nodeif you're running the Elastic Stack (Elasticsearch, Logstash, Kibana) and want unified observability across your infrastructure. It provides automatic instrumentation for many Node.js frameworks. For frontend monitoring, pair it with @elastic/apm-rum for complete distributed tracing. - loggly:
Choose
logglyif you need centralized log aggregation with search capabilities and your team prefers a dedicated logging service. Note that Loggly has shifted focus over time — evaluate current maintenance status before committing. Consider alternatives like Winston + cloud storage for more control. - newrelic:
Choose
newrelicif you want comprehensive APM with minimal configuration and your budget allows for a commercial solution. It offers automatic instrumentation and strong Node.js support. Best for teams that prefer managed services over self-hosted monitoring infrastructure. - opentracing:
Choose
opentracingif you need vendor-neutral distributed tracing and want to avoid lock-in. However, note that OpenTelemetry has largely superseded OpenTracing — consider @opentelemetry/api for new projects instead. Only use if you have existing OpenTracing infrastructure. - prom-client:
Choose
prom-clientif you're using Prometheus for metrics collection and want open-source, self-hosted monitoring. It's lightweight and gives you full control over metric definitions. Best for teams comfortable managing their own Prometheus infrastructure and Grafana dashboards. - raygun:
Choose
raygunif you need straightforward error tracking with good JavaScript support and prefer a simpler pricing model than competitors. It offers both frontend and backend monitoring. Consider if you need less complexity than Sentry but more features than basic logging.
Popular Comparisons
README for datadog-metrics
datadog-metrics
Buffered metrics reporting via the Datadog HTTP API.

![]()

Datadog-metrics lets you collect application metrics through Datadog's HTTP API. Using the HTTP API has the benefit that you don't need to install the Datadog Agent (StatsD). Just get an API key, install the module and you're ready to go.
The downside of using the HTTP API is that it can negatively affect your app's performance. Datadog-metrics solves this issue by buffering metrics locally and periodically flushing them to Datadog.
Installation
Datadog-metrics is compatible with Node.js v12 and later. You can install it with NPM:
npm install datadog-metrics --save
Example
Save the following into a file named example_app.js:
var metrics = require('datadog-metrics');
metrics.init({ host: 'myhost', prefix: 'myapp.' });
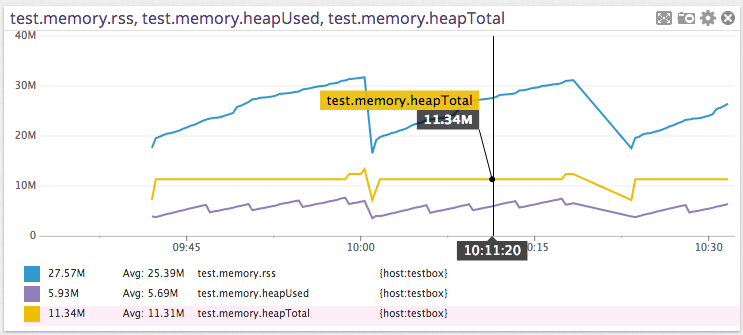
function collectMemoryStats() {
var memUsage = process.memoryUsage();
metrics.gauge('memory.rss', memUsage.rss);
metrics.gauge('memory.heapTotal', memUsage.heapTotal);
metrics.gauge('memory.heapUsed', memUsage.heapUsed);
};
setInterval(collectMemoryStats, 5000);
Run it:
DATADOG_API_KEY=YOUR_KEY DEBUG=metrics node example_app.js
Tutorial
There's also a longer tutorial that walks you through setting up a monitoring dashboard on Datadog using datadog-metrics.
Usage
Datadog API key
Make sure the DATADOG_API_KEY or DD_API_KEY environment variable is set to your Datadog API key (you can also set it via the apiKey option in code). You can find the API key under Integrations > APIs. Please note the API key is different from an application key. For more details, see Datadog’s “API and Application Keys” docs.
Module setup
There are three ways to use this module to instrument an application. They differ in the level of control that they provide.
Use case #1: Just let me track some metrics already!
Just require datadog-metrics and you're ready to go. After that you can call
gauge, increment and histogram to start reporting metrics.
var metrics = require('datadog-metrics');
metrics.gauge('mygauge', 42);
Use case #2: I want some control over this thing!
If you want more control you can configure the module with a call to init.
Make sure you call this before you use the gauge, increment and histogram
functions. See the documentation for init below to learn more.
var metrics = require('datadog-metrics');
metrics.init({ host: 'myhost', prefix: 'myapp.' });
metrics.gauge('mygauge', 42);
Use case #3: Must. Control. Everything.
If you need even more control you can create one or more BufferedMetricsLogger instances and manage them yourself:
var metrics = require('datadog-metrics');
var metricsLogger = new metrics.BufferedMetricsLogger({
    site: 'datadoghq.eu',
    apiKey: 'TESTKEY',
    host: 'myhost',
    prefix: 'myapp.',
    flushIntervalSeconds: 15,
    defaultTags: ['env:staging', 'region:us-east-1'],
    onError (error) {
        console.error('There was an error auto-flushing metrics:', error);
    }
});
metricsLogger.gauge('mygauge', 42);
API
Initialization
metrics.init(options)
Where options is an object and can contain the following:
-
host: Sets the hostname reported with each metric. (optional)- Setting a hostname is useful when you're running the same application on multiple machines and you want to track them separately in Datadog.
-
prefix: Sets a default prefix for all metrics. (optional)- Use this to namespace your metrics.
-
flushIntervalSeconds: How often to send metrics to Datadog. (optional)- This defaults to 15 seconds. Set it to
0to disable auto-flushing (which means you must callflush()manually).
- This defaults to 15 seconds. Set it to
-
site: Sets the Datadog "site", or server where metrics are sent. (optional)- Defaults to
datadoghq.com. - See more details on setting your site at: https://docs.datadoghq.com/getting_started/site/#access-the-datadog-site
- You can also set this via the
DATADOG_SITEorDD_SITEenvironment variable. - Ignored if you set the
reporteroption.
- Defaults to
-
apiKey: Sets the Datadog API key. (optional)- It's usually best to keep this in an environment variable.
Datadog-metrics looks for the API key in the
DATADOG_API_KEYorDD_API_KEYenvironment variable by default. - You must either set this option or the environment variable. An API key is required to send metrics.
- Make sure not to confuse this with your application key! For more details, see: https://docs.datadoghq.com/account_management/api-app-keys/
- Ignored if you set the
reporteroption.
- It's usually best to keep this in an environment variable.
Datadog-metrics looks for the API key in the
-
appKey: ⚠️ Deprecated. This does nothing and will be removed in an upcoming release.Sets the Datadog application key. This is not actually needed for sending metrics or distributions, and you probably shouldn’t set it. Do not confuse this with your API key! For more, see: https://docs.datadoghq.com/account_management/api-app-keys/
-
defaultTags: Default tags used for all metric reporting. (optional)- Set tags that are common to all metrics.
-
onError: A function to call when there are asynchronous errors seding buffered metrics to Datadog. It takes one argument (the error). (optional)- If this option is not set, the error will be logged to stderr.
-
histogram: An object with default options for all histograms. This has the same properties as the options object on thehistogram()method. Options specified when calling the method are layered on top of this object. (optional) -
retries: How many times to retry failed metric submissions to Datadog’s API.- Defaults to
2. - Ignored if you set the
reporteroption.
- Defaults to
-
retryBackoff: How long to wait before retrying a failed Datadog API call. Subsequent retries multiply this delay by 2^(retry count). For example, if this is set to1, retries will happen after 1, then 2, then 4 seconds.- Defaults to
1. - Ignored if you set the
reporteroption.
- Defaults to
-
reporter: An object that actually sends the buffered metrics. (optional)- There are two built-in reporters you can use:
reporters.DatadogReportersends metrics to Datadog’s API, and is the default.reporters.NullReporterthrows the metrics away. It’s useful for tests or temporarily disabling your metrics.
- There are two built-in reporters you can use:
Example:
metrics.init({ host: 'myhost', prefix: 'myapp.' });
Disabling metrics using NullReporter:
metrics.init({ host: 'myhost', reporter: metrics.NullReporter() });
Send metrics to a totally different service instead of Datadog:
metrics.init({
  reporter: {
    async report(series) {
      // `series` is an array of metrics objects, formatted basically how the
      // Datadog v1 metrics API and v1 distributions API want them.
      const response = await fetch('https://my-datadog-like-api.com/series', {
        method: 'POST',
        body: JSON.stringify({ series })
      });
      return await response.json();
    }
  }
});
Gauges
metrics.gauge(key, value[, tags[, timestamp]])
Record the current value of a metric. The most recent value since the last
flush will be recorded. Optionally, specify a set of tags to associate with the
metric. This should be used for sum values such as total hard disk space,
process uptime, total number of active users, or number of rows in a database
table. The optional timestamp is in milliseconds since 1 Jan 1970 00:00:00 UTC,
e.g. from Date.now().
Example:
metrics.gauge('test.mem_free', 23);
Counters
metrics.increment(key[, value[, tags[, timestamp]]])
Increment the counter by the given value (or 1 by default). Optionally,
specify a list of tags to associate with the metric. This is useful for
counting things such as incrementing a counter each time a page is requested.
The optional timestamp is in milliseconds since 1 Jan 1970 00:00:00 UTC,
e.g. from Date.now().
Example:
metrics.increment('test.requests_served');
metrics.increment('test.awesomeness_factor', 10);
Histograms
metrics.histogram(key, value[, tags[, timestamp[, options]]])
Sample a histogram value. Histograms will produce metrics that
describe the distribution of the recorded values, namely the minimum,
maximum, average, median, count and the 75th, 85th, 95th and 99th percentiles.
Optionally, specify a list of tags to associate with the metric.
The optional timestamp is in milliseconds since 1 Jan 1970 00:00:00 UTC,
e.g. from Date.now().
Example:
metrics.histogram('test.service_time', 0.248);
You can also specify an options object to adjust which aggregations and percentiles should be calculated. For example, to only calculate an average, count, and 99th percentile:
metrics.histogram('test.service_time', 0.248, ['tag:value'], Date.now(), {
    // Aggregates can include 'max', 'min', 'sum', 'avg', 'median', or 'count'.
    aggregates: ['avg', 'count'],
    // Percentiles can include any decimal between 0 and 1.
    percentiles: [0.99]
});
Distributions
metrics.distribution(key, value[, tags[, timestamp]])
Send a distribution value. Distributions are similar to histograms (they create several metrics for count, average, percentiles, etc.), but they are calculated server-side on Datadog’s systems. This is much higher-overhead than histograms, and the individual calculations made from it have to be configured on the Datadog website instead of in the options for this package.
You should use this in environments where you have many instances of your
application running in parallel, or instances constantly starting and stopping
with different hostnames or identifiers and tagging each one separately is not
feasible. AWS Lambda or serverless functions are a great example of this. In
such environments, you also might want to use a distribution instead of
increment or gauge (if you have two instances of your app sending those
metrics at the same second, and they are not tagged differently or have
different host names, one will overwrite the other — distributions will not).
Example:
metrics.distribution('test.service_time', 0.248);
Flushing
By default, datadog-metrics will automatically flush, or send accumulated
metrics to Datadog, at regular intervals, and, in environments that support it,
before your program exits. (However, if you call process.exit() to cause a
hard exit, datadog-metrics doesn’t get a chance to flush. In this case, you may
want to call await metrics.stop() first.)
You can adjust the interval by using the flushIntervalSeconds option. Setting
it to 0 will disable auto-flushing entirely:
// Set auto-flush interval to 10 seconds.
metrics.init({ flushIntervalSeconds: 10 });
You can also send accumulated metrics manually at any time by calling
metrics.flush().
Please note that, when calling the BufferedMetricsLogger constructor directly,
flushIntervalSeconds defaults to 0 instead. When constructing your own
logger this way, you must expicitly opt-in to auto-flushing by setting a
positive value.
metrics.flush()
Sends any buffered metrics to Datadog and returns a promise. By default,
flush() will be called for you automatically unless you set
flushIntervalSeconds to 0 (see above for more details).
⚠️ This method used to take two callback arguments for handling successes and errors. That form is deprecated and will be removed in a future update:
// Deprecated:
metrics.flush(
    () => console.log('Flush suceeded!'),
    (error) => console.log('Flush error:', error)
);

// Current, using `await`:
try {
    await metrics.flush();
    console.log('Flush suceeded!');
} catch (error) {
    console.log('Flush error:', error);
}

// Or, using Promise callbacks:
metrics.flush()
    .then(() => console.log('Flush succeeded'))
    .catch((error) => console.log('Flush error:', error)) ;
metrics.stop(options)
Stops auto-flushing (if enabled) and flushes any currently buffered metrics.
This is mainly useful if you want to manually clean up and send remaining
metrics before hard-quitting your program (usually by calling process.exit()).
Returns a promise for the result of the flush.
Takes an optional object with properties:
flush(boolean) Whether to flush any remaining metrics after stopping. Defaults totrue.
Logging
Datadog-metrics uses the debug
library for logging at runtime. You can enable debug logging by setting
the DEBUG environment variable when you run your app.
Example:
DEBUG=metrics node app.js
Contributing
Contributions are always welcome! For more info on how to contribute or develop locally, please see CONTRIBUTING.md.
Release History
0.12.1 (2024-12-18)
New Features:
-
When auto-flushing is enabled, metrics are now also flushed before the process exits. In previous versions, you needed to do this manually by calling
metrics.flush()at the every end of your program. (#141)You will still need to flush manually if you set
flushIntervalSecondsto0orstop()(see below) if you are quitting your program by callingprocess.exit()(which interrupts a variety of operations). -
A new
stop()method disables auto-flushing and flushes any currently buffered metrics (you can leave metrics in the buffer instead with theflushoption:stop({flush: false})). (#141)
0.12.0 (2024-12-05)
Datadog-metrics now automatically retries failed metric submissions and uses promises for asynchronous actions! There are a handful of other deprecations and small improvements.
Breaking Changes:
- The
DatadogReporterconstructor now takes an options object instead of positional arguments. Using this constructor directly is pretty rare, so this won’t affect most users. (#138)
New Features:
-
Promises: asynchronous actions now use promises instead of callbacks. Callbacks are deprecated, but still work — they’ll be fully removed in v0.13.0. This affects:
- The
flush()method now returns a promise. - The
report(series)method on any custom reporters should now return a promise. For now, datadog-metrics will use the old callback-based behavior if the method signature has callbacks listed afterseriesargument.
(See #125)
- The
-
Retries: flushes to Datadog’s API are now retried automatically. This can help you work around intermittent network issues or rate limits. To adjust retries, use the
retriesandretryBackoffoptions.metrics.init({ // How many times to retry. To disable retries, set this to 0. retries: 2, // How long (in seconds) to wait between retries. Subsequent retries // wait exponentially longer. retryBackoff: 1 });(See #138)
-
Environment variables: you can now use either
DATADOG_orDD_prefixes for environment variables (previously, onlyDATADOG_worked). For example, you can set your API key viaDATADOG_API_KEYorDD_API_KEY. (#137)
Deprecations:
-
The
appKeyoption is no longer supported. Application keys (as opposed to API keys) are not actually needed for sending metrics or distributions to the Datadog API. Including it in your configuration adds no benefits, but risks exposing a sensitive credential. (#127) -
The
DATADOG_API_HOSTenvironment variable is now deprecated. Please useDATADOG_SITEorDD_SITEinstead (theapiHostoption was renamed tositein v0.11.0, but theDATADOG_API_HOSTenvironment variable was accidentally left as-is). (#134)
0.11.4 (2024-11-10)
This release updates the TypeScript types for this project, and doesn’t include any changes to functionality. There are also no changes since v0.11.4-a.1.
Bug Fixes:
-
BufferedMetricsLoggeris now an actual class & type when you import it in TypeScript. That is, you can now do:import { BufferedMetricsLogger } from 'datadog-metrics'; function useLogger(logger: BufferedMetricsLogger) { // ... }Previously, you would have had to declare the type for
loggerastypeof BufferedMetricsLogger.prototype. (#120)
0.11.4-a.1 (2024-10-31)
This pre-release is meant for testing a fix for #119.
Bug Fixes:
- Typings: Ensure
BufferedMetricsLoggeris seen as an actual class & type when importing in TypeScript. (#120)
0.11.3 (2024-10-31)
⚠️ No changes in this release since v0.11.2. This fixes a publishing error with v0.11.3a1.
0.11.3a1 (2024-10-31)
⛔️ Do not use this release.
0.11.2 (2024-06-25)
Fixes & Maintenance:
-
Fix types and documentation for the
aggregatesoption for histograms and thehistogram.aggregatesoption for the library as a whole. It was previously listed asaggregations, which was incorrect. (Thanks to @Calyhre in #117.) -
Improve documentation and add a more detailed error message about API keys vs. application keys. (#118)
0.11.1 (2023-09-28)
Fixes & Maintenance:
- Resolve a deprecation warning from the underlying datadog-api-client library. This also updates the minimum required version of that library. (Thanks to @acatalucci-synth & @fcsonline in #112.)
0.11.0 (2022-02-21)
New Features:
-
Built-in TypeScript definitions. If you use TypeScript, you no longer need to install separate type definitions from
@types/datadog-metrics— they’re now built-in. Please make sure to remove@types/datadog-metricsfrom your dev dependencies.Even if you’re writing regular JavaScript, you should now see better autocomplete suggestions and documentation in editors that support TypeScript definitions (e.g. VisualStudio Code, WebStorm).
Breaking Changes:
- datadog-metrics now uses modern
classsyntax internally. In most cases, you shouldn’t need to change anything. However, if you are callingBufferedMetricsLogger.apply(...)orBufferedMetricsLogger.call(...), you’ll need to change your code to usenew BufferedMetricsLogger(...)instead.
Deprecated Features:
-
The
apiHostoption has been renamed tositeso that it matches up with Datadog docs and official packages. The oldapiHostname still works for now, but will be removed in the future. -
The
reporters.DataDogReporterclass has been renamed toreporters.DatadogReporter(lower-case D in "dog") so that it correctly matches Datadog’s actual name. The old name still works, but will be removed in the future.
0.10.2 (2022-10-14)
This release includes several new features and bugfixes!
New Features:
-
Support for distribution metrics. You can now send distributions to Datadog by doing:
const metrics = require('datadog-metrics');
metrics.distribution('my.metric.name', 3.8, ['tags:here']);
Distributions are similar to histograms (they create several metrics for count, average, percentiles, etc.), but they are calculated server-side on Datadog’s systems. For more details and guidance on when to use them, see:
- The documentation in this project’s README
- Datadog’s documentation at https://docs.datadoghq.com/metrics/distributions/
(Thanks to @Mr0grog.)
-
Add an
onErroroption for handling asynchronous errors while flushing buffered metrics. You can use this to get details on an error or to send error info to a tracking service like Sentry.io:const metrics = require('datadog-metrics'); metrics.init({ onError (error) { console.error('There was an error sending to Datadog:', error); } }); -
The built-in reporter classes are now available for you to use. If you need to disable the metrics library for some reason, you can now do so with:
const metrics = require('datadog-metrics');
metrics.init({
    reporter: new metrics.reporters.NullReporter(),
});
(Thanks to @Mr0grog.)
-
Add an option for setting histogram defaults. In v0.10.0, the
histogram()function gained the ability to set what aggregations and percentiles it generates with a finaloptionsargument. You can now specify ahistogramoption forinit()orBufferedMetricsLoggerin order to set default options for all calls tohistogram(). Any options you set in the actualhistogram()call will layer on top of the defaults:const metrics = require('datadog-metrics'); metrics.init({ histogram: { aggregates: ['sum', 'avg'], percentiles: [0.99] } }); // Acts as if the options had been set to: // { aggregates: ['sum', 'avg'], percentiles: [0.99] } metrics.histogram('my.metric.name', 3.8); // Acts as if the options had been set to: // { aggregates: ['sum', 'avg'], percentiles: [0.5, 0.95] } metrics.histogram('my.metric.name', 3.8, [], Date.now(), { percentiles: [0.5, 0.95] });(Thanks to @Mr0grog.)
-
Add a
.medianaggregation for histograms. When you log a histogram metric, it ultimately creates several metrics that track the minimum value, average value, maximum value, etc. There is now one that tracks the median value. StatsD creates the same metric from histograms, so you may find this useful if transitioning from StatsD. (Thanks to @Mr0grog.) -
This package no longer locks specific versions of its dependencies (instead, your package manager can choose any version that is compatible). This may help when deduplicating packages for faster installs or smaller bundles. (Thanks to @Mr0grog.)
Bug Fixes:
- Don’t use
unref()on timers in non-Node.js environments. This is a step towards browser compatibility, although we are not testing browser-based usage yet. (Thanks to @Mr0grog.) - The
apiHostoption was broken in v0.10.0 and now works again. (Thanks to @Mr0grog and @npeters.) - Creating a second instance of
BufferedMetricsLoggerwill not longer change the credentials used by previously createdBufferedMetricsLoggerinstances. (Thanks to @Mr0grog.)
Internal Updates:
- Renamed the default branch in this repo to
main. (Thanks to @dbader.) - Use GitHub actions for continuous integration. (Thanks to @Mr0grog.)
- Code style cleanup. (Thanks to @Mr0grog.)
- When flushing, send each metric with its own list of tags. This helps mitigate subtle errors where a change to one metric’s tags may affect others. (Thanks to @Mr0grog.)
0.10.1 (2022-09-11)
- FIX: bug in 0.10.0 where
@datadog/datadog-api-clientwas not used correctly. (Thanks to @gquinteros93)
0.10.0 (2022-09-08)
-
Breaking change: we now use Datadog’s official
@datadog/datadog-api-clientpackage to send metrics to Datadog. This makesdatadog-metricsusable with Webpack, but removes theagentoption. If you were using this option and the new library does not provide a way to meet your needs, please let us know by filing an issue! (Thanks to @thatguychrisw) -
You can now customize what metrics are generated by a histogram. When logging a histogram metric, the 5th argument is an optional object with information about which aggregations and percentiles to create metrics for:
const metrics = require('datadog-metrics');
metrics.histogram('my.metric.name', 3.8, [], Date.now(), {
    // Aggregates can include 'max', 'min', 'sum', 'avg', or 'count'.
    aggregates: ['max', 'min', 'sum', 'avg', 'count'],
    // Percentiles can include any decimal between 0 and 1.
    percentiles: [0.75, 0.85, 0.95, 0.99]
});
(Thanks to @gquinteros93.)
-
INTERNAL: Clean up continuous integration on TravisCI. (Thanks to @ErikBoesen.)
0.9.3 (2021-03-22)
- INTERNAL: Update
dogapiandjshintto their latest versions. (Thanks to @ErikBoesen.)
0.9.2 (2021-03-14)
-
Expose new
apiHostoption oninit()andBufferedMetricsLoggerconstructor. This makes it possible to actually configure the Datadog site to submit metrics to. For example, you can now submit metrics to Datadog’s Europe servers with:const metrics = require('datadog-metrics'); metrics.init({ apiHost: 'datadoghq.eu' });(Thanks to @ErikBoesen.)
0.9.1 (2021-02-19)
- FIX: Add default Datadog site. (Thanks to @ErikBoesen.)
0.9.0 (2021-02-10)
- Clean up continuous integration tooling on TravisCI. (Thanks to @rpelliard.)
- Correct “Datadog” throughout the documentation. It turns out there’s not supposed to be a captial D in the middle. (Thanks to @dbenamy.)
- INTERNAL: Add internal support for submitting metrics to different Datadog sites (e.g.
datadoghq.eufor Europe). (Thanks to @fermelone.)
0.8.2 (2020-11-16)
- Added @ErikBoesen as a maintainer!
- INTERNAL: Update
dogapiversion. - INTERNAL: Validate the
onSuccesscallback inNullReporter. (Thanks to @dkMorlok.)
0.8.1
- FIX: don't increment count when value is 0 (Thanks to @haspriyank)
0.8.0
- allow passing in custom https agent (Thanks to @flovilmart)
0.7.0
- update metric type
countertocountascounteris deprecated by Datadog (Thanks to @dustingibbs)
0.6.1
- FIX: bump debug to 3.1.0 to fix NSP Advisory #534 (Thanks to @kirkstrobeck)
0.6.0
- FIX: call onSuccess on flush even if buffer is empty (Thanks to @mousavian)
0.5.0
- ADD: ability to set custom timestamps (Thanks to @ronny)
- FIX: 0 as valid option for flushIntervalSeconds (thanks to @dkMorlok)
0.4.0
- ADD: Initialize with a default set of tags (thanks to @spence)
0.3.0
- FIX: Don't overwrite metrics with the same key but different tags when aggregating them (Thanks @akrylysov and @RavivIsraeli!)
- ADD: Add success/error callbacks to
metrics.flush()(Thanks @akrylysov!) - ADD: Allow Datadog APP key to be configured (Thanks @gert-fresh!)
- Bump dependencies to latest
- Update docs
0.2.1
- Update docs (module code remains unchanged)
0.2.0
- API redesign
- Remove
setDefaultXYZ()and addedinit()
0.1.1
- Allow
incrementto be called with a default value of 1
0.1.0
- The first proper release
- Rename
countertoincrement
0.0.0
- Work in progress
Meta
This module is heavily inspired by the Python dogapi module.
Daniel Bader – @dbader_org – mail@dbader.org
Distributed under the MIT license. See LICENSE for more information.
Your contributions are always welcome! See CONTRIBUTING.md for more.